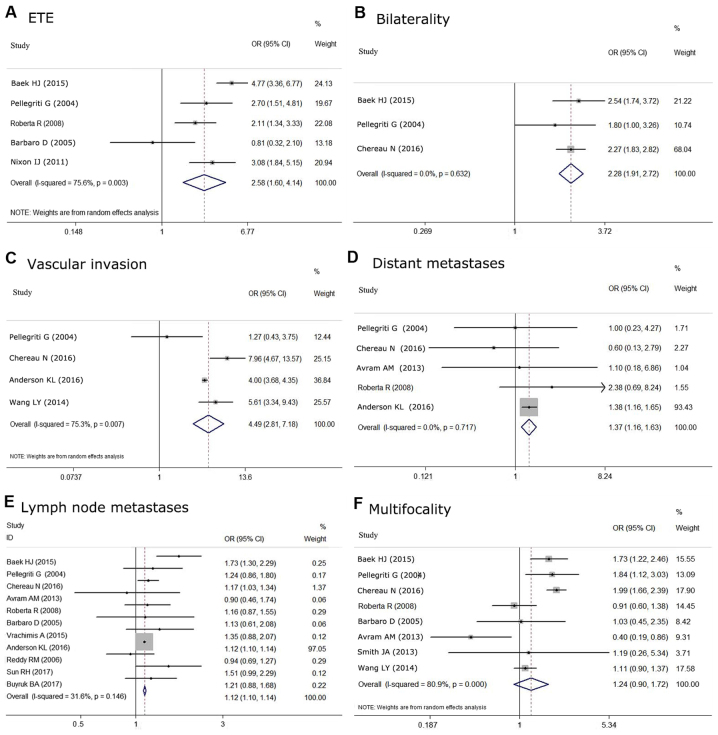
Figure 6.
Associations with aggressive histologic features between subgroups (S2 vs. S1) are shown as the OR with 95% CIs. (A) The random effects model for the association with ETE. (B) The fixed effects model for the correlation with bilaterality. (C) The random effects model for the correlation with vascular invasion. (D) The fixed effects model for the correlation with distant metastases. (E) The fixed effects model for the correlation with lymph node metastases. (F) The random effects model for the correlation with multifocality. CI, confidence interval; OR, odds ratio; sDTC, small-differentiated thyroid carcinoma; ETE, extrathyroidal extension.

