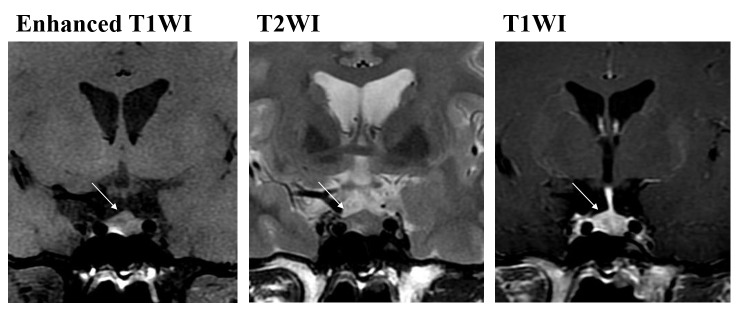
Figure 1.
Enhanced T1WI, and T2WI and T1WI of pituitary microadenomas at the same position. Nodules exhibit low signal on T1WI and marginally high signal on T2WI (shown with an arrow). In the enhanced images, the signal intensity of the nidus is weaker compared with that of normal pituitary tissue. T1WI, T1-weighted image; T2WI, T2-weighted image.

