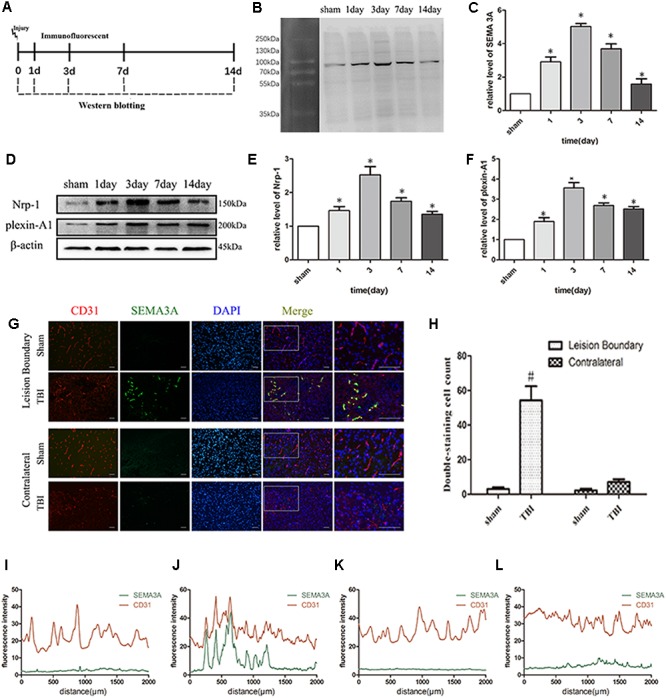
FIGURE 1.

TBI altered the expression of SEMA3A and its related receptors, Nrp-1 and plexin-A1. (A) Schematic diagram of the experimental design. (B,C) Quantitative data from western blotting illustrating the time course of SEMA3A following TBI, with an increase on the first day post-TBI and peaked on the third day. (D–F) Quantitative data from western blotting illustrating the time course of the related receptors of SEMA3A following TBI, with an increase on the first day post-TBI and peaked on the third day. (G–L) Double-immunostaining data indicating that SEMA3A was mainly secreted and concentrated at the lesion boundary after TBI. (I) Fluorescence intensity of lesion boundary of sham group. (J) Fluorescence intensity of lesion boundary of TBI group. (K) Fluorescence intensity of contralateral of sham group. (L) Fluorescence intensity of contralateral of TBI group. Scale bar = 50 μm. The data are expressed as the mean ± SEM, and n = 6 for each group. ∗p < 0.05 vs. sham groups, #p < 0.01 vs. sham group and TBI contralateral group.
