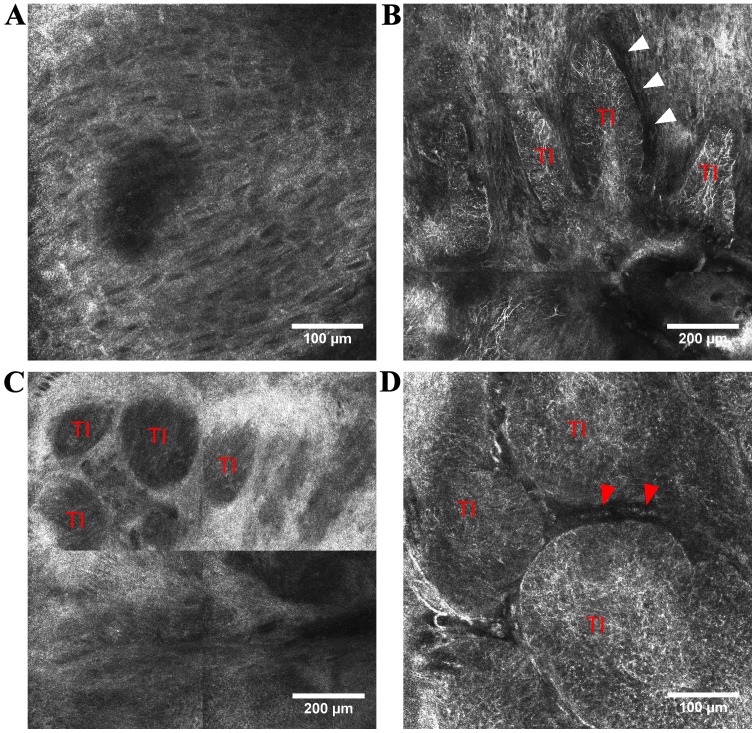
Figure 1.
RCM features of BCC. (A) RCM image (500×500 µm) showing polarization of keratinocytes along the same axis forming epidermal ‘streaming’; (B) RCM mosaic (1×1 mm) in the tumoral area of a pigmented BCC displaying elongated TI infiltrated by bright dendritic cells, peripheral palisading and peritumoral dark spaces (white arrowheads), also known as ‘clefting’; (C) RCM mosaic (1×1 mm) showing ‘dark silhouettes’ representing TI, in the tumor region of a nodular BCC; (D) RCM image (500×500 µm) of BCC showing TI infiltrated by dendritic cells and blood vessels (red arrowheads) surrounding the neoplastic dermal aggregates. TIs, tumor islands.

