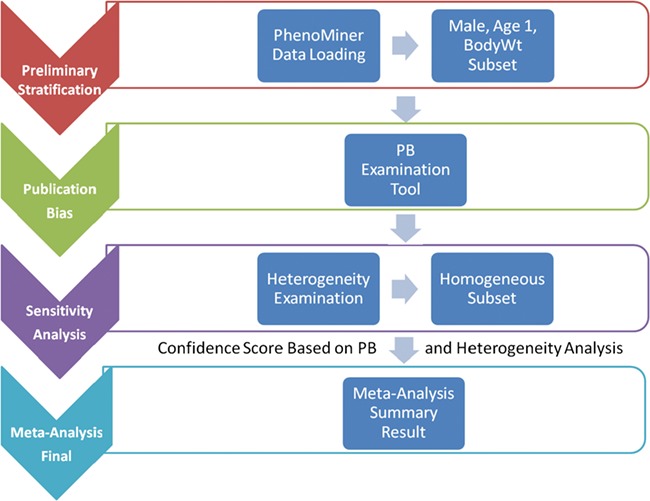
Figure 1.

System pipeline for meta-analysis. (1) Preliminary stratification: Choose a subset of phenotype measurements based on preliminary stratification, which included strain (including similar strains inbred at different locations and substrains), sex, age group and phenotype measurement methods. (2) Publication bias: One key concern is publication bias, which arises because experiments with negative findings are less likely to be published than those that highlight results which support hypotheses. We used funnel plot to examine any publication bias. (3) Sensitivity analysis: Data with poor quality for non-systematic reasons are often an issue in meta-analysis so selection, inclusion and integration (or population stratification) of data are an important factors for consideration, which can be completed through sensitivity analysis. (4) Meta-analysis result summary: Results will be displayed in a forest plot. The x-axis is the value of measurement or effect size. Each datum is shown as a blob or square. The size of the blob or square is proportional to the sample size. A horizontal line representing 95% confidence interval is drawn through the center of each study’s square to represent the uncertainty of the measurement.
