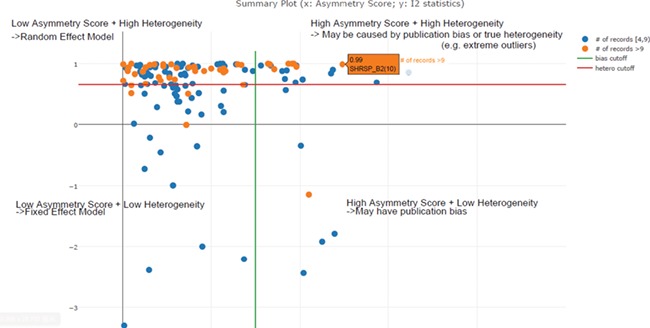
Figure 5.

Scatter plot of asymmetry score and I2 statistics for different meta-analysis results for body weight data (x: asymmetry score; y: I2 statistics). The four quadrants represent different characteristics of datasets for each meta-analysis task. Quadrant 1 (top right) represents a high asymmetry score and high heterogeneity, which may be caused by publication bias or true heterogeneity (e.g. extreme outliers). Quadrant 2 represents a high asymmetry score and low heterogeneity, which may indicate true publication bias. Quadrant 3 represents a low asymmetry score and low heterogeneity, which indicates that we should choose the fixed-effect model. Quadrant 4 represents a low asymmetry score and high heterogeneity, which indicates that we should choose the random-effect model. From this summary plot, we can determine that I2 = 0. 85 (represented by the red line) is an optimal cut-off threshold to separate high and low heterogeneity datasets.
