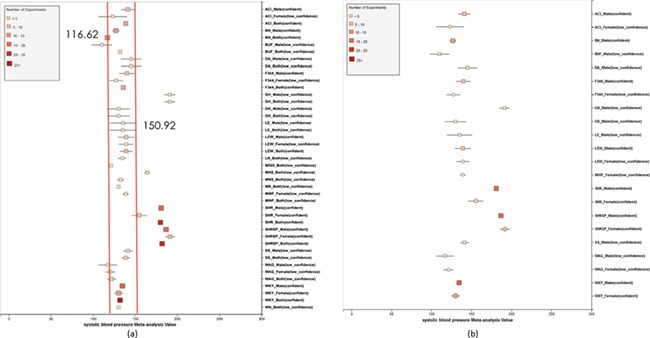
Figure 7.

(a) Forest plot of meta-analysis summary for `Systolic Blood Pressure’. The center of the box represents the meta-analysis mean and the range determined by one standard deviation above and below the meta-analysis value. The color of the boxes showed the total number of experiments that made up of the meta-analysis range. It is a sign of confidence for the resulting phenotype range. On the right side, the legend shows the strain and sex of which the range is representing. In the bracket, we also noted the confidence level of analysis considering the total number of experiments (<4, low_confidence; ≥, 4 confident). (b) Forest plot with different indicator shapes for different genders. Users will have the option to choose display between (a) and (b).
