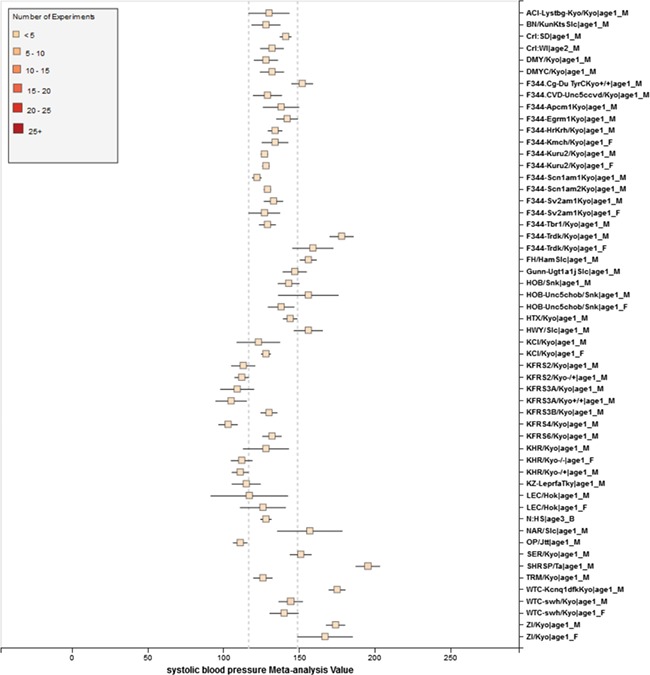
Figure 8.

RGD phenotype expected ranges for `Systolic Blood Pressure’ for outbred and mutant strains under naïve control conditions. The dotted lines represent the expected range for the `Control Strain Group’ based on 14 inbred strains used as controls for this phenotype.
