Figure 6.
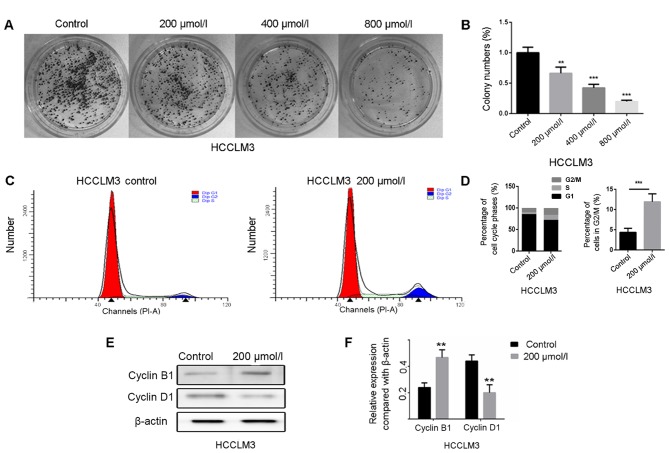
Polydatin inhibits proliferation of HCCLM3 cells. (A) Representative images of colony formation of HCCLM3 cells following treatment with polydatin at various concentrations. (B) Statistical analysis of the colony formation assay. (C) Cell cycle analysis results of HCCLM3 cells following treatment with or without 200 mol/l polydatin. (D) Statistical analysis of the percentage of cells in the G2/M phase. (E) Alterations in protein expression levels of cyclin B1 and cyclin D1 in HCCML3 cells, following treatment with or without polydatin (200 µmol/l) evaluated by western blotting. (F) Statistical analysis of protein expression. **P<0.01, ***P<0.001 vs. control.

