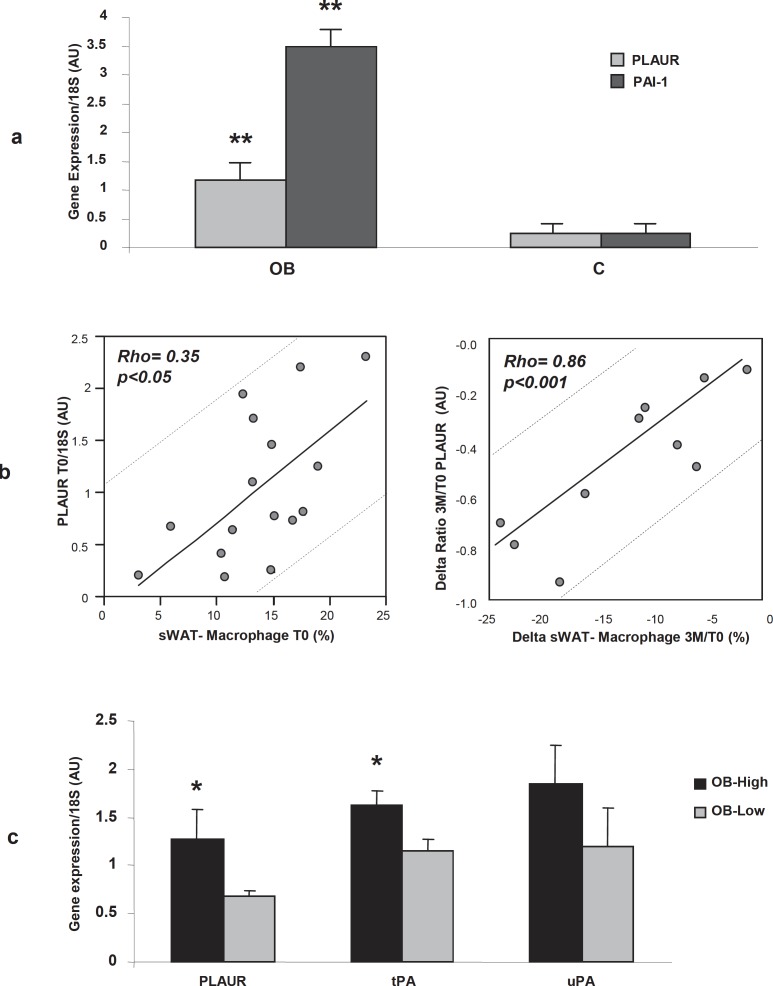
Fig. 1.
a PLAUR mRNA (grey blocks) and PAI-1 mRNA (dark blocks) expression (normalized on 18S expression and expressed as AU in obese (OB, n = 16) versus lean controls (C, n = 7). ** p value < 0.01 OB versus C. b Correlations between macrophage content (%) and PLAUR gene expression (by RTqPCR, AU) in obese sWAT at basal condition (T0, n = 16) (left panel) and between the variation of sWAT macrophage content (delta sWAT macrophage content 3M/T0, %) and the variation of PLAUR expression levels by microarrays (delta ratio before/after surgery (3M/T0, AU, n = 10) (right panel). c PLAUR, tPA, and uPA gene expression (by RTqPCR), normalized on 18S expression, in obese patients regrouped by the median of macrophage content (%) in sWAT. Patients with a high degree of infiltration (OB-High, black blocks, n = 8) and patients with lower macrophage infiltration levels (OB-Low, grey blocks, n = 8) are shown; AU = arbitrary units; *p value < 0.05 OB-High versus OB-Low.

