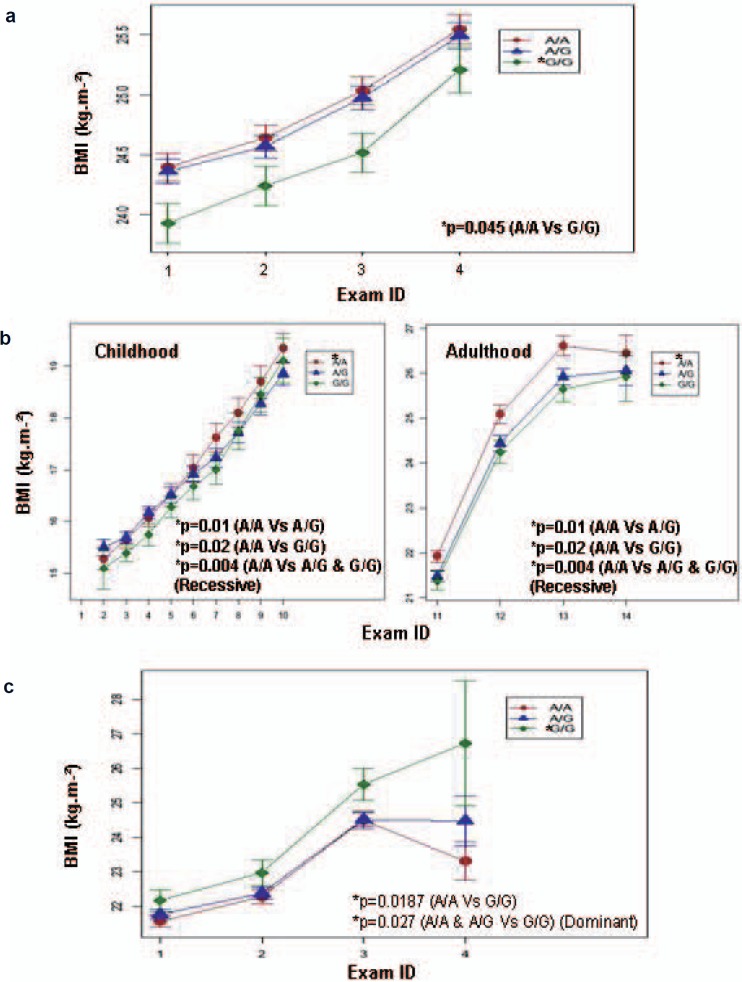
Fig. 1.
Evolution of BMI according to CST3 rs2424577 genotypes. Evolution (means ± SE) of BMI according to rs2424577 genotype (A/A: red circle, A/G: blue triangle and G/G: green diamond) during study period in a French individuals from the SUVIMAX group (2 to 13 years follow-up), b the group of Danish lean men, and c Swedish women from the SPAWN group (1984–2000) (exams are described in table 1 and 2). G/G and A/G carriers had a lower BMI than A/A carriers at each exam in the group of French individuals and in the group of Danish lean men. On the contrary, G/G carriers had a higher BMI at each exam than A/G and A/A carriers in the group of Swedish women. *Significant p values.

