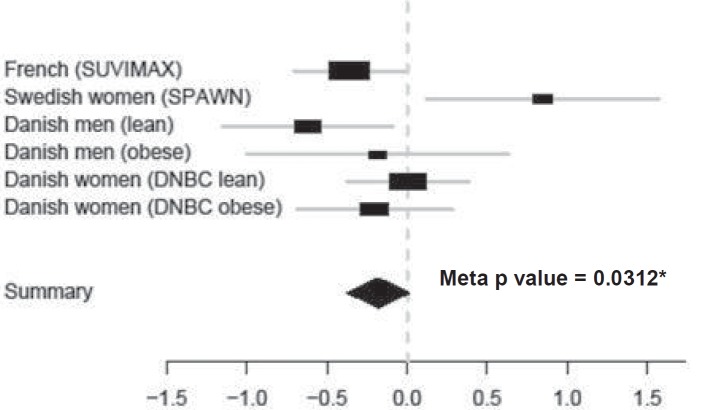
Fig. 3.
Meta analysis of CST3 rs2424577 A/A versus G/G association with BMI. Estimates (black rectangles) ± 95% CI (grey lines) for CST3 rs2424577 G/G versus A/A comparison in each group and global estimate (black diamond). The overall estimate of G/G versus A/A is –0.18 (95% CI –0.37 to 0.02) and the overall p value is 0.0312. Globally, G/G carriers have a significantly lower BMI than A/A carriers.

