Figure 5. .
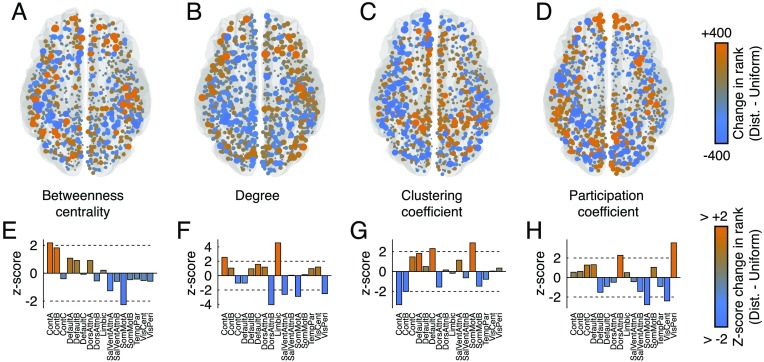
Comparing spatial distribution of hubs. We compare four measures of hubness: (A) betweenness centrality, (B) degree, (C) clustering coefficient, and (D) participation coefficient. Rather than compare raw values, which can fluctuate because of small differences in global network properties like total number of connections or weight, we compare ranked values of each measure and observe whether a node’s rank is smaller/greater under the distance-dependent or uniform method. Orange-colored nodes indicate that a node’s value is greater under the distance-dependent method than it is under the uniform method. Blue-colored nodes indicate the opposite. We then aggregated node-level differences in ranked measures by cognitive systems and compared the mean system-level values with those obtained under a null method. In panels (E)–(H) we show the z-scored system means. In general, large-magnitude z-scores indicate bigger greater system-level differences between the two methods.

