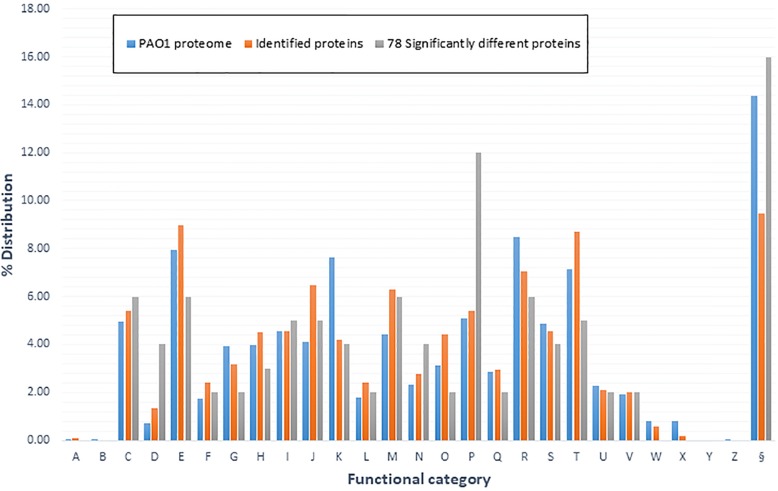
Fig. 1.
COG functional categories used to represent major biological functions. This distribution map highlights the COG % distribution for all non-redundant proteins from this experiment and 78 proteins deemed significantly differentially regulated. This also contains the % distribution for 5698 proteins of PAO1 – PAO1 proteome (derived from the PGD). The COG functional categories are: a– RNA processing and modification, b– chromatin structure and dynamics, c– energy production and dynamics, d– cell cycle control, cell division, and chromatin partitioning, e– amino acid transport and metabolism, f– nucleotide transport and metabolism, g– carbohydrate transport and metabolism, h– coenzyme transport and metabolism, i– lipid transport and metabolism, j– translation, ribosomal structure, and biogenesis, k– transcription, l– replication, repair, and recombination, m– cell wall/membrane/envelope biogenesis, n– cell motility, o– post-translational modification, protein turnover, and chaperones, p– inorganic ion transport, q– secondary metabolite biosynthesis, transport, and catabolism, r– general function prediction only, s– function unknown, t– signal transduction mechanisms, u– intracellular trafficking, secretion, and vesicular transport, v– defense mechanisms, w– extracellular structures, x– mobilome: prophages, and transposons, y– nuclear structure, z– cytoskeleton, and § – no COG assignment

