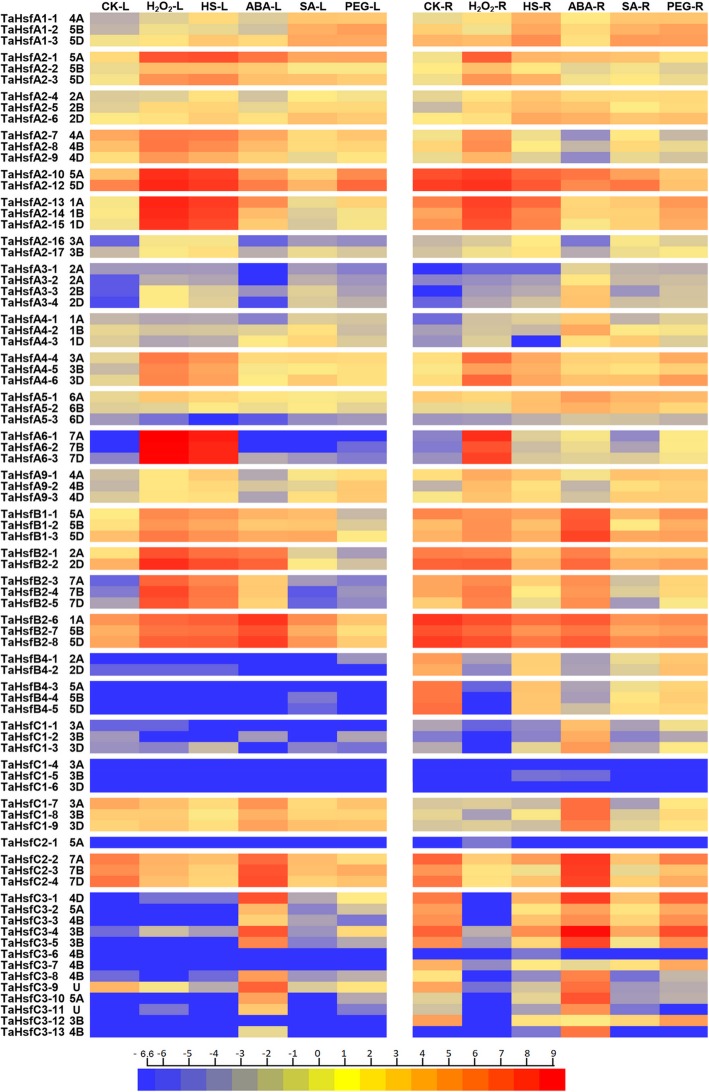
Fig. 6.
The transcription profiles of the TaHsf family genes in leaf (L) and root (R) tissues after H2O2, heat stress (HS), ABA, salicylic acid (SA) and polyethylene glycol (PEG) treatments. A heat map is drawn to illustrate the relative expression profiles of TaHsfs. Different colors correspond to log2 transformed values. Red or blue indicates higher or lower relative abundance of each transcript in each sample, respectively

