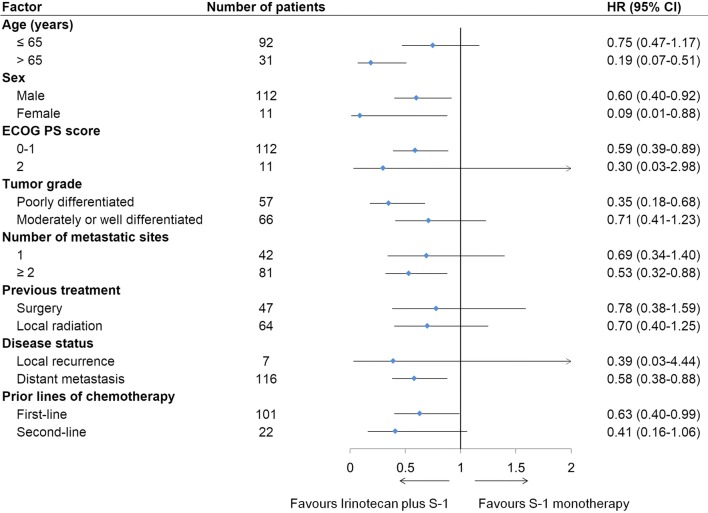
Fig. 3.
Forest plot illustrating the progression-free survival in prespecified subgroups. The arrows, above the scale, pointing to the right indicates that the upper limit of the 95% CI of HR exceeds 2. HR hazard ratio, CI confidence interval, ECOG PS Eastern Cooperative Oncology Group performance score

