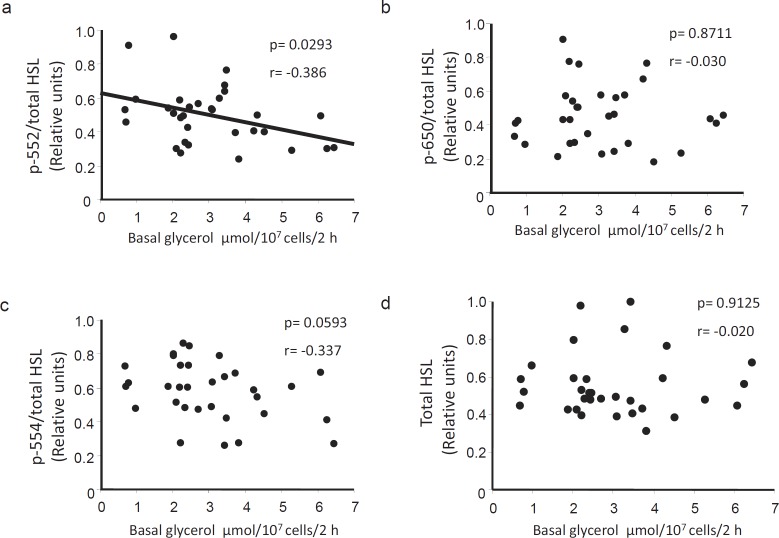
Fig. 2.
Correlations between basal lipolysis and phosphorylated/total HSL levels. Graphs depicting the correlation between basal lipolysis in vitro and a p-Ser552, b p-Ser650 and c p-Ser554 HSL as well as d total protein levels (n = 32). Protein levels were determined by Western blot using antibodies directed against the respective phospho-serine sites or total protein. The quotient between phosphorylated and total HSL levels was used in a–c. Basal lipolysis was assessed in isolated adipocytes by measuring the amount of glycerol released (μmole) per 107 cells after incubation for 2 h in an albumin-containing buffer.

