Fig. 5.
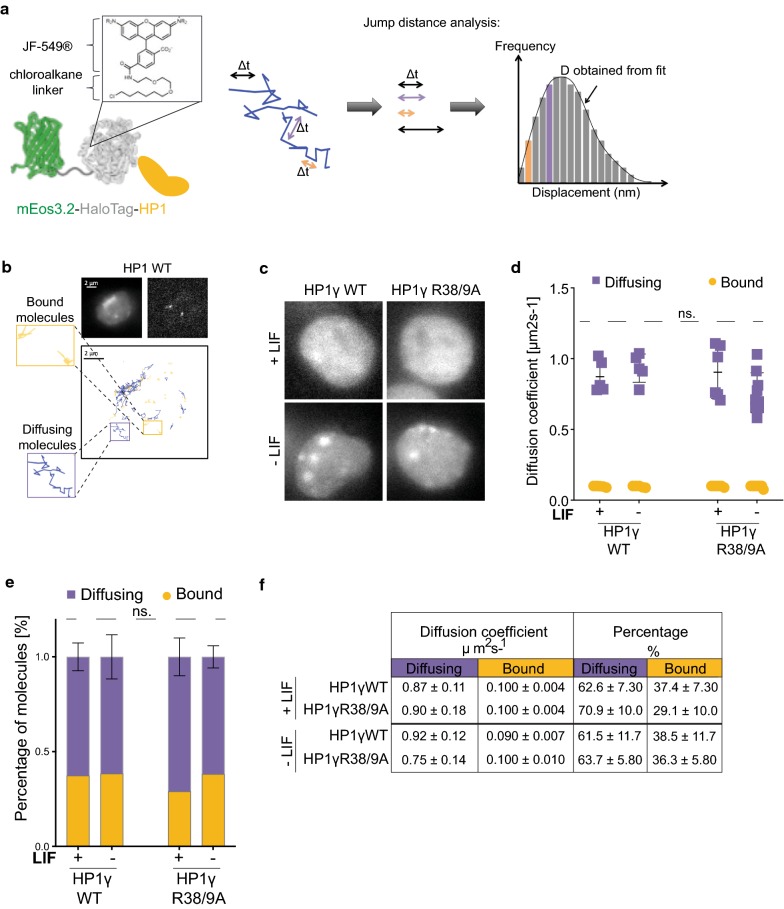
Mutation of HP1γ R38 and R39 does not affect diffusion rate of diffusing molecules. Statistical analyses were performed using two-way ANOVA multiple corrections with Sidak post hoc test. mESCs were cultured +/− LIF for 72 h. a Schematic illustration of mEos3.2–HaloTag–HP1 fusion proteins used for single-particle tracking (left panel). X-ray crystal structures of green EosFP (PDB_1ZUX) and HaloTag (PDB_5UXZ) are shown together with the chemical structure of JF549 dye coupled to the HaloTag-chloroalkane linker. Right panel shows schematic illustration of jump distance (JD) analysis of single-particle tracking (SPT) data to determine diffusion coefficients (d). JD analysis plots a histogram of all particle displacements within a fixed time interval Δt for all trajectories. Fitting the distribution of displacements yields the minimum number of diffusion coefficients needed to describe the motion of the particles. b Representative mEos3.2 fluorescent images at 488 nm excitation of mESCs expressing mEos3.2–HaloTag–HP1WT and single molecule tracks of HaloTag–JF549-tagged molecules are shown. Bound and diffusing molecules are highlighted. c Representative mEos3.2 fluorescent images of mESCs expressing mEos3.2–HaloTag–HP1γWT and HP1γR38/9A. Scale bar: 2 μm. d/e SPT of mEos3.2–HaloTag–HP1γWT and HP1γR38/9A in mESCs. d Cells were labelled with HaloTag–JF549 ligand and subjected to 2D SPT. At 561 nm, fluorescent images were collected as movies of 10,000 frames at 13.5 ms time resolution. Plot depicts diffusion coefficients (D) [μm2 s−1] of the indicated HP1 molecules. Bars represent ± SD (n = 5–9). Multiple comparisons resulted in no significant differences across conditions (ns. p values > 0.999). e Percentages of molecules within diffusing and bound fractions (ns. p values > 0.967). f Tabulated summary of results shown in d and e

