Fig. 6.
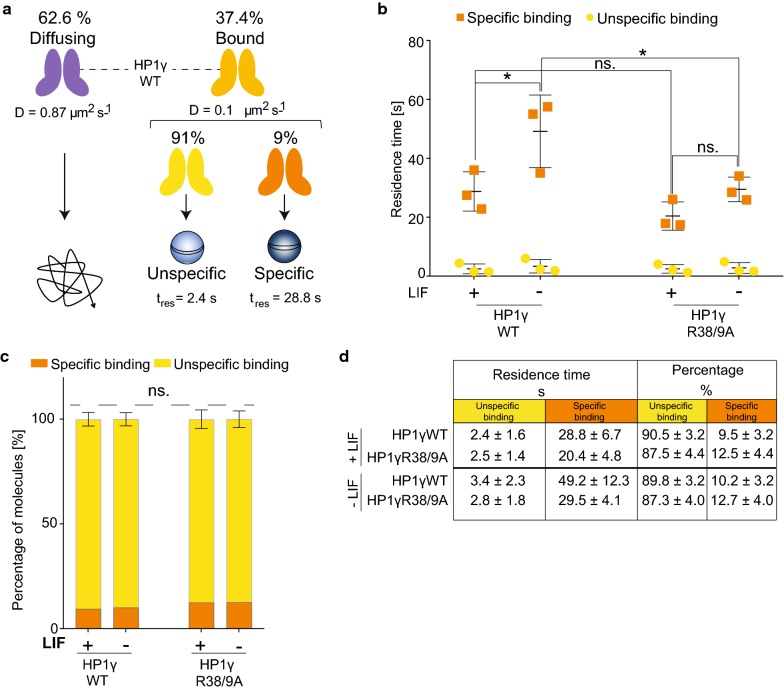
HP1γ R38 and R39 influence chromatin residence time in differentiating mESCs. Statistical analyses were performed using two-way ANOVA multiple corrections with Sidak post hoc test. mESCs were cultured +/− LIF for 72 h. a Schematic illustration of HP1γ dynamics in mESCs. SPT of mEos3.2–HaloTag–HP1γ molecules at 13.5 ms time resolution determines two fractions with individual diffusion coefficients: diffusing and bound. SPT at 500 ms time resolution allows further detection of molecule dynamics within the bound fraction (~ 37.4% of all detectable HP1γ molecules). Within the bound fraction, two populations with individual residence times (tres) [s] are detected: unspecific (tres = 2.4 s) and specific (tres = 28.8 s). b/c SPT of mEos3.2–HaloTag–HP1γWT and HP1γR38/9A in mESCs. b Cells were labelled with HaloTag–JF549 ligand and subjected to SPT. At 561 nm, fluorescent images were collected as movies of 1000 frames at 500 ms time resolution. Left panel depicts the tres for specific and unspecific binding of the indicated HP1 molecules. Bars represent ± SD (n = 3) (*p value left to right = 0.027, 0.036; ns. p value > 0.841). C Percentages of molecules with unspecific and specific tres. d Tabulated summary of results shown in b and c. Errors represent ± SD (n = 3)

