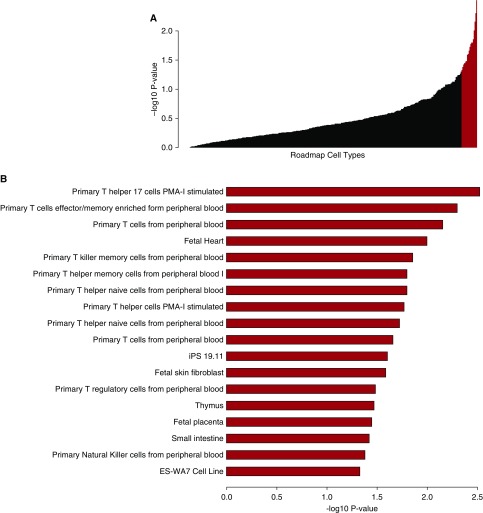
Figure 3.
Plot of the cell type enrichment −log10 P value from the Genomic Annotation Shifter (GoShifter) analyses of the overlaps between emphysema distribution–associated genetic variants with DNase I–hypersensitive peaks, DNase I hotspots, enhancer marks, and digital DNase I footprints. The cell types with enrichment P values less than 0.05 are colored red in A and shown in more detail in B. iPS = induced pluripotent stem cell; PMA-I = phorbol 12-myristate 13-acetate plus ionomycin.

