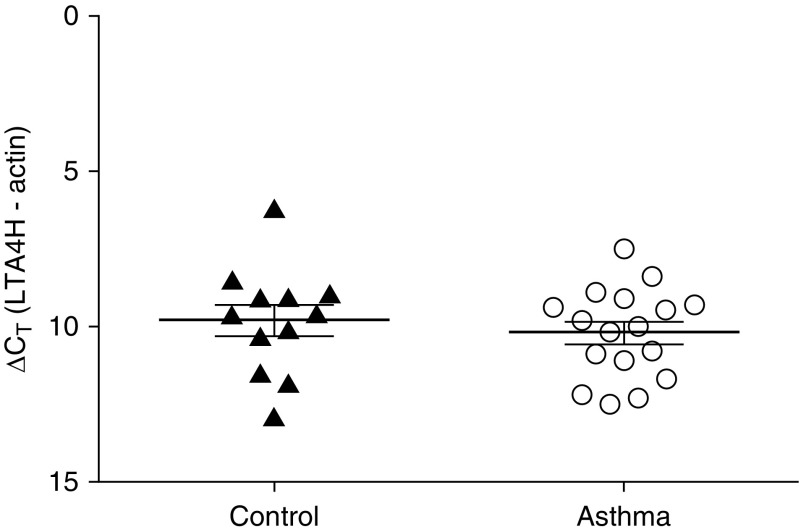
Figure 5.
LTA4H mRNA expression in eosinophils. After separation of blood using Ficoll-Hypaque density centrifugation and dextran sedimentation, eosinophils were enriched using magnetic affinity column purification. Transcript levels of LTA4H were quantified using PCR with SYBR Green detection. Data (mean ± SEM) reflect the relative expression of each gene in comparison with the housekeeping gene β-actin (∆CT). Control samples (n = 12) are depicted by solid triangles, and asthma samples are indicated (n = 17) by open circles.

