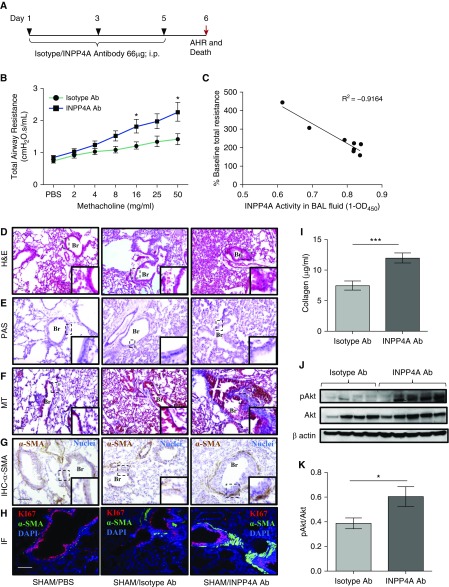
Figure 2.
Antibody-mediated neutralization of INPP4A in naive mice leads to induction of an asthma-like phenotype. (A) Experimental protocol for antibody-mediated neutralization of INPP4A in naive mice. AHR = airway hyperresponsiveness; i.p. = intraperitoneal. (B) Total airway resistance upon methacholine challenge after treatment with anti-INPP4A or isotype antibody in naive mice. Ab = antibody. (C) Correlation analysis of INPP4A activity in BAL fluid with % baseline total airway resistance of mice treated with isotype or anti-INPP4A antibody. OD450 = optical density 450. (D–F) Histopathological analysis of lung sections of mice to assess airway inflammation by hematoxylin and eosin (H&E) staining (D), goblet cell metaplasia by periodic acid–Schiff (PAS) staining (E), and subepithelial fibrosis by Masson’s trichrome (MT) staining (F). Scale bar: 100 μm. (G) Immunohistochemistry (IHC) to assess the expression of α-smooth muscle actin (α-SMA) in lung sections. Brown color indicates positive expression of α-SMA; nuclei are stained in blue color. Scale bar: 100 μm. (H) Immunofluorescence (IF) with anti-Ki67 (red) and anti–α-SMA (green) in lung sections of naive mice treated with isotype or anti-INPP4A antibody (panel elaborated, along with isotype-matched control IgG, in Figure E1E). Nuclei are stained by DAPI (blue). Br = bronchus. Scale bar: 100 μm. (I) Content of soluble collagen in the lungs of mice treated with isotype or anti-INPP4A antibody as measured by Sircol assay. (J and K) Immunoblotting for expression of pAkt with respect to total Akt in the lung samples of antibody-treated mice (J), and its densitometric analysis (K). Results are expressed as the mean ± SEM (n = 3–10 mice/group). *P < 0.05 and ***P < 0.001 versus isotype antibody. Statistical differences were calculated in the naive mouse model experiment using Student’s t test.

