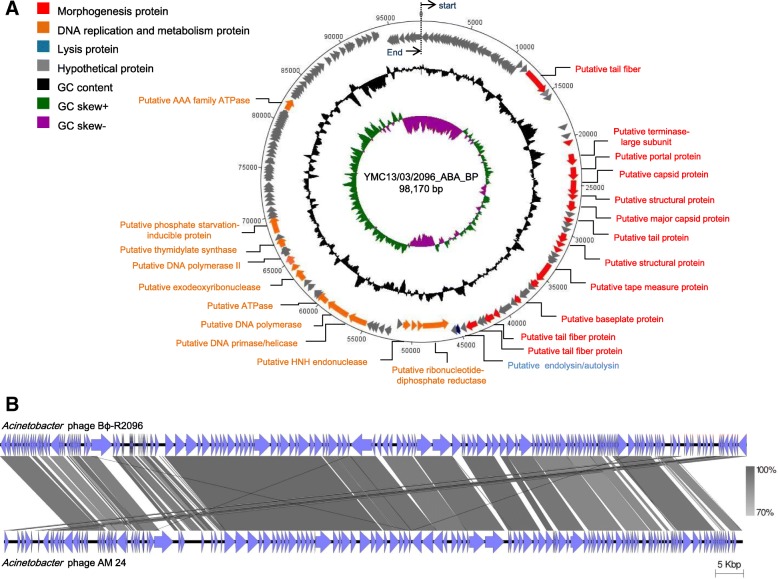
Fig. 3.
Circular map of the A. baumannii phage Bϕ-R2096 genome (a) and genome comparison between A. baumannii phage Bϕ-R2096 and phage AM24 (b). Circular map of the A. baumannii phage Bϕ-R2096 prepared using DNAPlotter (a). The outer arrows present ORFs of phage Bϕ-R2096 and the direction of transcription. The GC content appears in the black ring, and the inner rings are GC skew+ (+, green; −, purple). Genomes of A. baumannii phage Bϕ-R2096 and phage AM24 were compared using Easyfig software (b). Homology (blastn) is indicated between gray lines for each phage genomes and putative ORFs with direction of transcription are presented as arrows

