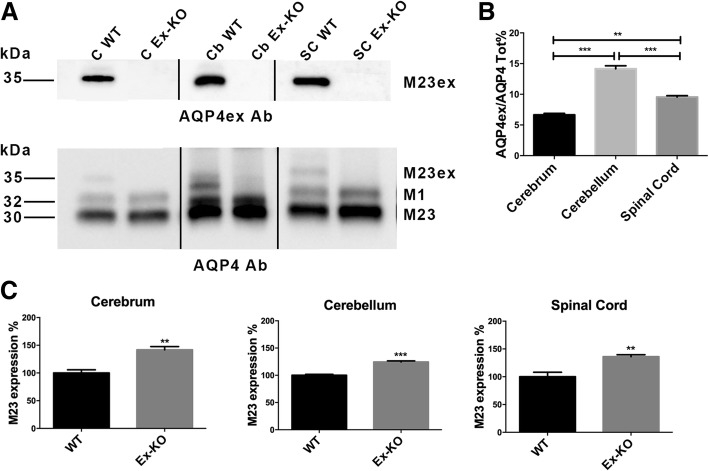
Fig. 2.
Immunoblot analysis of AQP4 isoforms in WT and AQP4ex-KO mice CNS. a A typical immunoblot is shown with cerebrum (C), cerebellum (Cb) and spinal cord lysates (SC) probed with anti-AQP4ex (top) and anti-AQP4 antibodies (bottom). Note the absence of the M23ex isoform of about ~ 35 kDa in the AQP4ex-KO extracts. Using commercial AQP4 antibody (bottom), three bands of ~ 30, ~ 32 and ~ 35 kDa were detected corresponding to AQP4-M23, AQP4-M1 and AQP4-M23ex, respectively. b Bar chart showing the mean ± SE of the percentage of AQP4ex relative to the total AQP4 measured by immunoblotting in the CNS tissues of WT mouse (****p < 0.0001; ** p < 0.001, n = 5). c Bar chart showing the mean ± SE of expression levels of AQP4-M23 isoform in WT and AQP4ex-KO cerebrum, cerebellum and spinal cord. Note that the amount of the canonical M23-AQP4 increases in the CNS of AQP4ex-KO mice (Student’s t-test ***p < 0.001; ** p < 0.01, n = 3)

