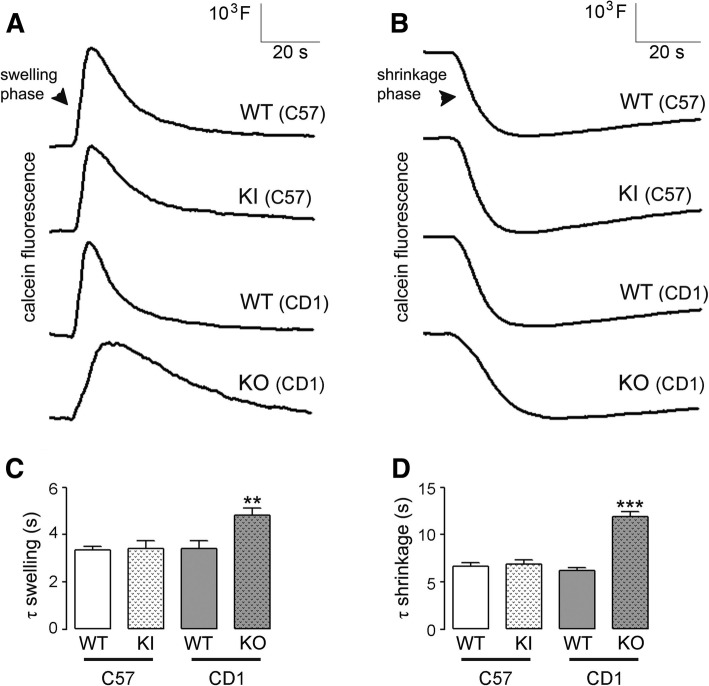
Fig. 5.
Water transport measurements in astrocytes primary cultures. Calcein-quenching measurement of osmotically induced volume changes in primary cultured astrocytes from AQP4ex null, AQP4-KO and WT mice. a Typical traces of cell volume changes, recorded for the indicated astroglial cells, upon exposure to a hypotonic (240 mOsm/L; Δ 60 mOsm/L) (a) or hypertonic (360 mOsm/L; Δ 60 mOsm/L) b solutions. Note in A the recovery of the fluorescence, as a consequence of the volume regulatory decrease following the hypotonic shock. c,d, Histograms showing the mean ± SE values of time constants (τ) obtained by fitting an exponential curve to the cell swelling (c) or shrinking (d) phases of astrocyes after osmotic challenges obtained from 15 to 22 different measurements of three sets of independent experiments (***p < 0.0001; **p < 0.001)

