Fig. 6.
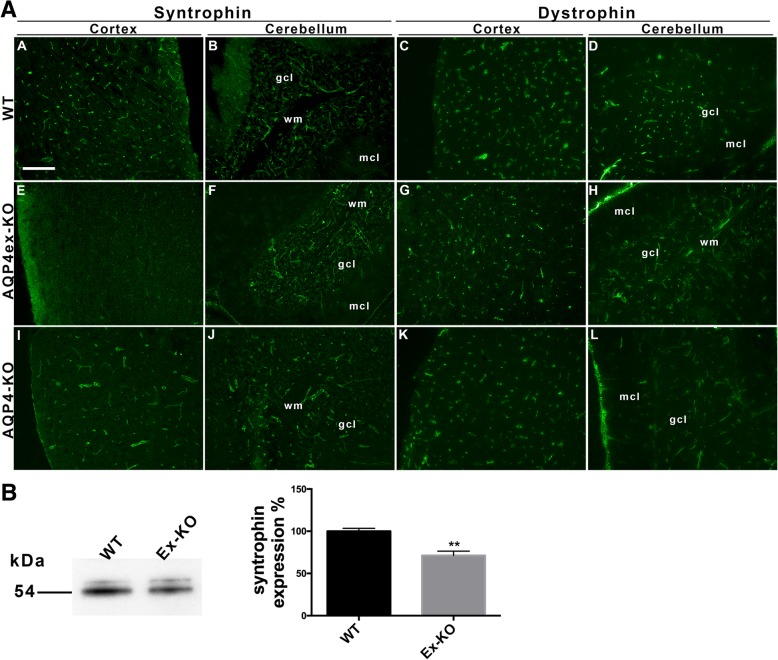
α-syntrophin and dystrophin expression in AQP4ex deficient mice. a Expression levels evaluated by IF in WT and AQP4ex –KO mice. For comparison AQP4-KO mice were also analyzed. Note that the perivascular staining of syntrophin in the cortex of AQP4ex-KO mouse is altered (E) while in the cerebellum it appears slightly reduced (F) in both granular (gcl) and molecular cell layers (mcl). No major changes in the dystrophin immunofluorescence signal were found the same areas. wm, white matter. Scale bar 50 μm. b Immunoblot analysis (left) of syntrophin expression in WT and AQP4ex-KO mice cerebrum cortex. Left, histogram showing syntrophin protein levels measured by immunblot in cerebrum (mean +/−SE, *p < 0.05; n = 6)

