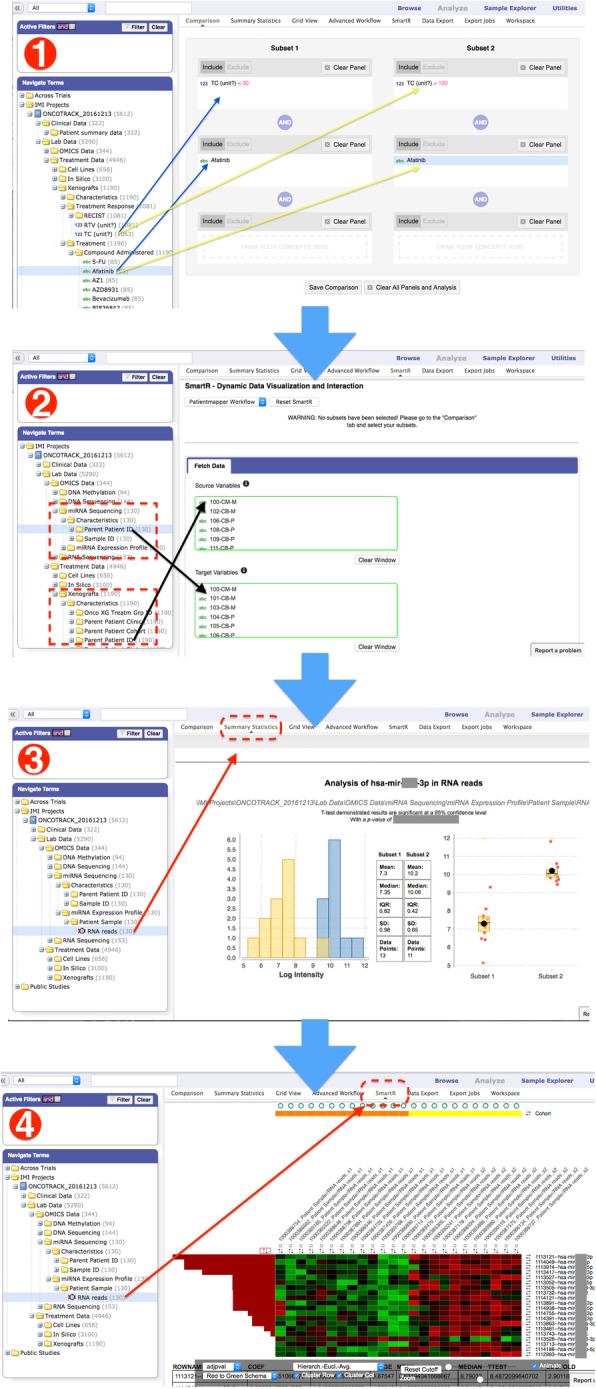
Fig. 3.

Integration of OncoTrack data into tranSMART: (1) Left panel: Overall data representation in the TranSMART data tree. Right panel: easy customized cohort building with drag-and-drop. (2) Cascaded querying with cohort linking/selection tool PatientMapper. (3) Generating summary statistics of a miRNA of choice by dragging the miRNA-Seq node to the right panel and providing miRNA ID using the HiDome plugin. (4) Performing miRNA-ome wide heatmap analysis between the two sub-cohorts (here responder vs. non-responder for a selected drug treatment) using SmartR workflows
