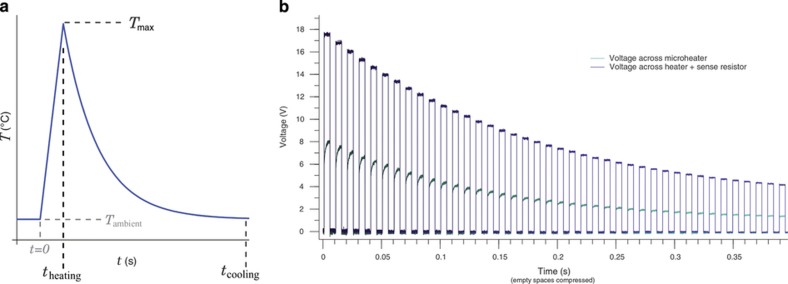
Figure 12.
A series of temperature pulses, shown in (b), administered by microheater recreates the temperature profile (a) of a post-detonation environment: rapid heating followed by exponential cooling. Each pulse is driven by a voltage (top curve) administered for 5 ms by a programmable pulse generator; a power resistor in series with the microheater allows monitoring (bottom curve) of the heater’s resistance, and thus temperature, via digital oscilloscope. The time between pulses has been truncated in (b) for display.

