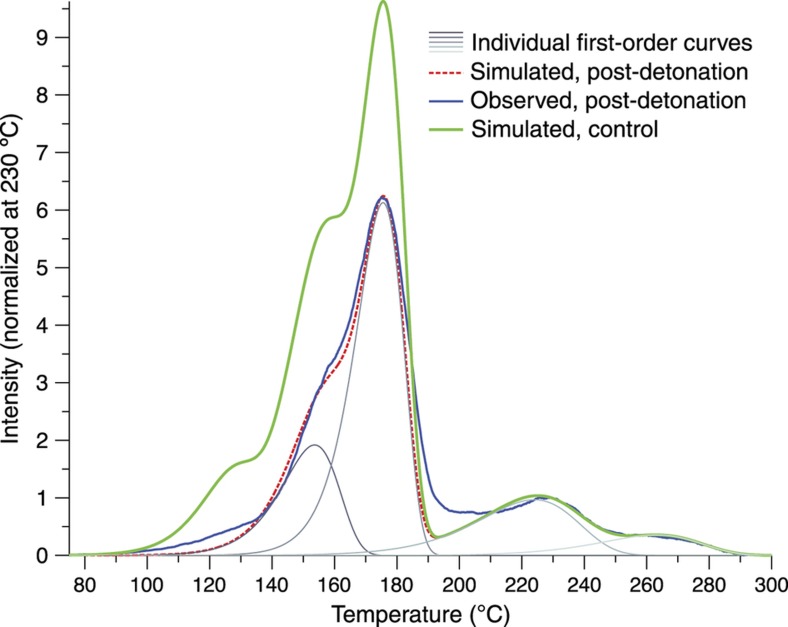
Figure 16.
The thermoluminescence signal of a sample of TLD-100 particles after a closed-chamber detonation is compared with several simulated glow curves: a pre-detonation curve, modeled from a control sample; a simulated curve after experiencing a detonation-style thermal event reaching a maximum temperature of 240 °C and cooled in about 0.4 s; and the individual first-order trap species which are summed to form the material model, most of which are calculated to be heavily depopulated here after the detonation. Modified from Ref. 26.

