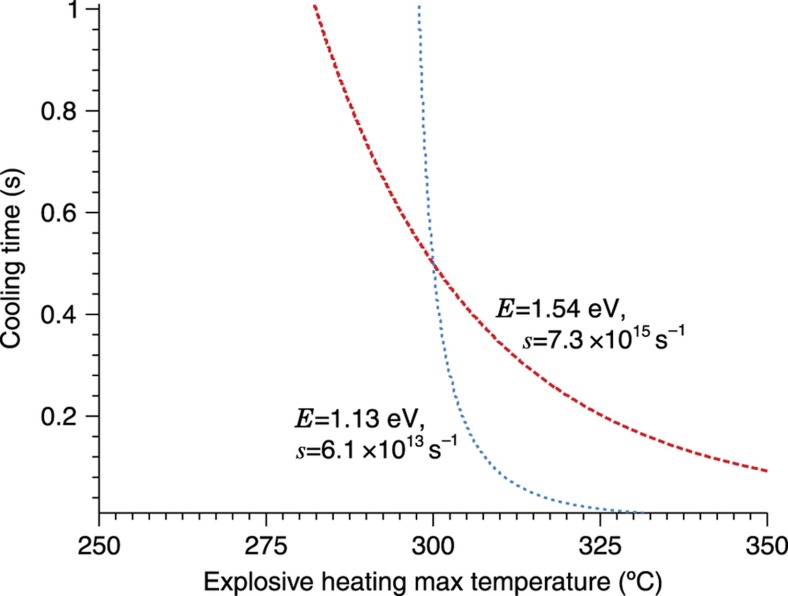
Figure 8.
Two simulated first-order traps, explosively heated to a certain maximum temperature and then allowed to cool with a certain time constant, will each display a certain final population density. Each trap could also reach the same population density via a series of slightly different scenarios, which can be represented on the plane defined by the two heating parameters as a line of equivalent depopulation; however, only one scenario—located at the intersection of these lines—will match both traps with the ‘actual’ population densities that the post-detonation glow curve would indicate. The task of thermal history reconstruction is to deduce information from these lines of equivalent depopulation and find the heating scenario where all traps (ideally) agree26.

