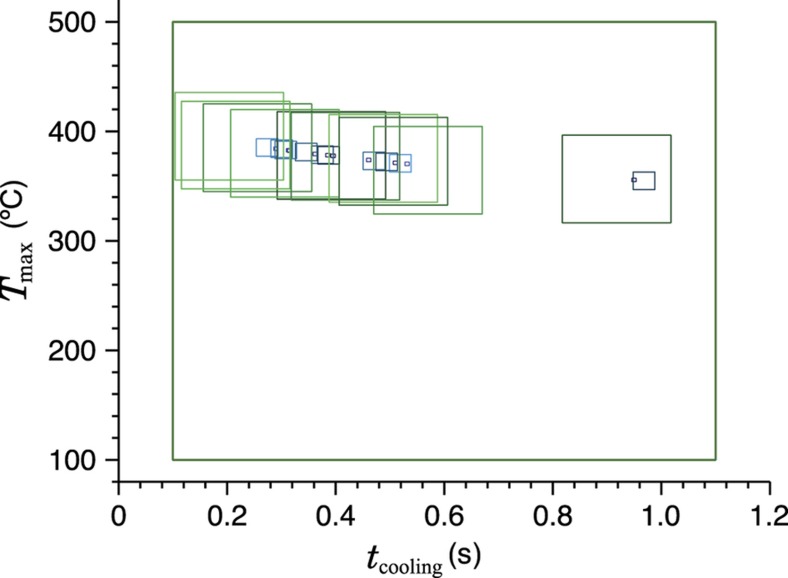
Figure 9.
An illustration of an iterative search process reconstructing the two-parameter explosive heating history. The two-dimensional plane of possible heating scenarios is sampled at uniformly distributed points and the quality of the match between each point’s simulated glow curve and the actual observed TL calculated. A certain number of more tightly-bounded planes are established, centered at the points which most closely matched the data, and the process repeats in each of these planes. Observed in graphical form, progressively smaller boxes highlight the search areas of each iteration and outline the shape of the lines of equivalent depopulation. Four iterations of area refinement are visible here. (The simulated material contains several traps, but due to their parameters and the particular scenario being sought the equivalent depopulation lines are fairly close together26.) TL, thermoluminescence.

