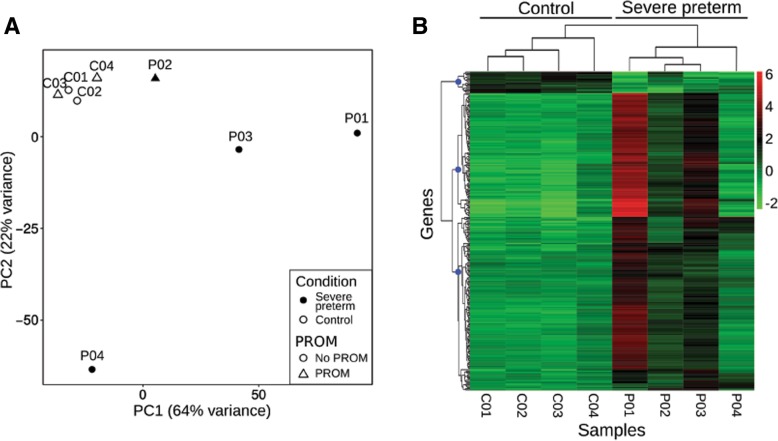
Fig. 1.
Overall gene expression of fetal membrane transcriptomes. a Principal component analysis (PCA) plot, denoting preterm and PROM conditions. b Heatmap of regularized log (rlog) normalized values of expression levels and hierarchical clustering for the 270 DE genes (FDR < 0.05 and absolute logarithm fold change > 2). The hierarchical clustering dendrogram and the condition of each sample are denoted at the top. Rlog values are coded on the red-to-green scale (high expression: red; low expression: green). Blue dots on the gene’s dendrogram nodes represent 3 major groups according to gene expression patterns. In sample names, the prefix P is used for preterms and C for controls

