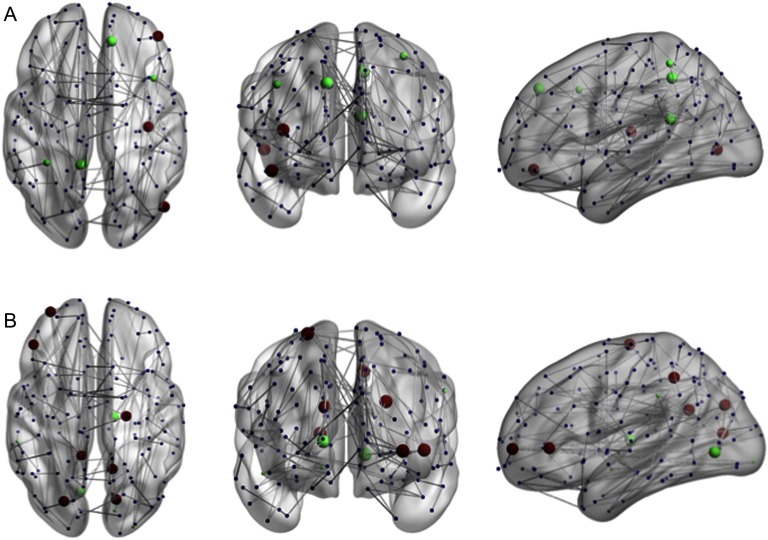
Figure 5. .
Significant changes in between- and within-module scores associated with the HSS. (A) Nodes with a significant correlation between participation coefficients and the HSS. (B) Nodes with a significant correlation between the module degree z-score and HSS. Green indicates a positive correlation, red indicates a negative correlation. Larger nodes are part of the subnetwork. Figure visualized with BrainNet Viewer (Xia et al., 2013).

