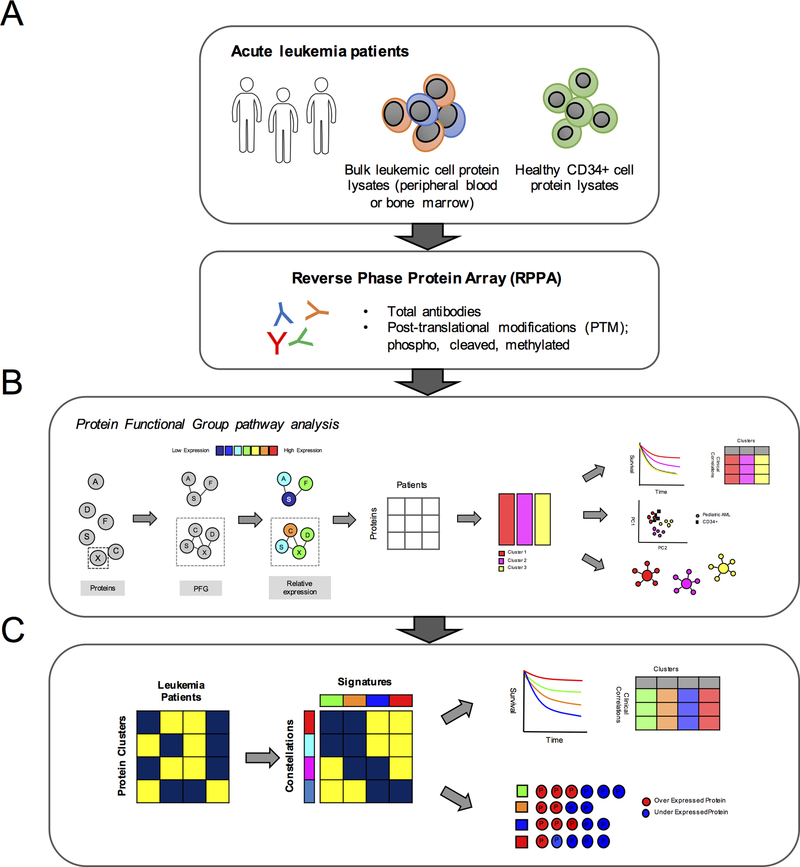
Figure 1. Computational workflow.
The foundation for modeling the protein expression was the establishment of 31 “Protein Functional Groups” (PFG); groups of protein pathways known from the existing literature. (A) Samples were collected from bone marrow or peripheral blood and protein lysates prepared from the blast population. (B) Protein clusters were identified within each PFG using the “Progeny clustering” algorithm [55]. Principal component analysis was used to determine if a protein cluster was similar or different from the normal CD34+ samples. Protein clusters were associated with therapy response and patient demographics. (C) Protein clusters from all 31 PFG were then assembled into a large binary dataset; 1 (blue) if a member of a protein cluster, 0 (yellow) if not. Block clustering analysis was used to search for correlation between protein clusters. Protein clusters from various PFG that were strongly correlated with each other were defined as “Protein Constellation” (horizontally). Patients that expressed similar combinations of protein constellations were grouped into patient signatures (vertically). Protein signatures were correlated with outcome and disease and patient characteristics. Within each protein signature and constellation, lists of proteins that were significantly up or down regulated compared to the normal CD34+ samples were identified.

