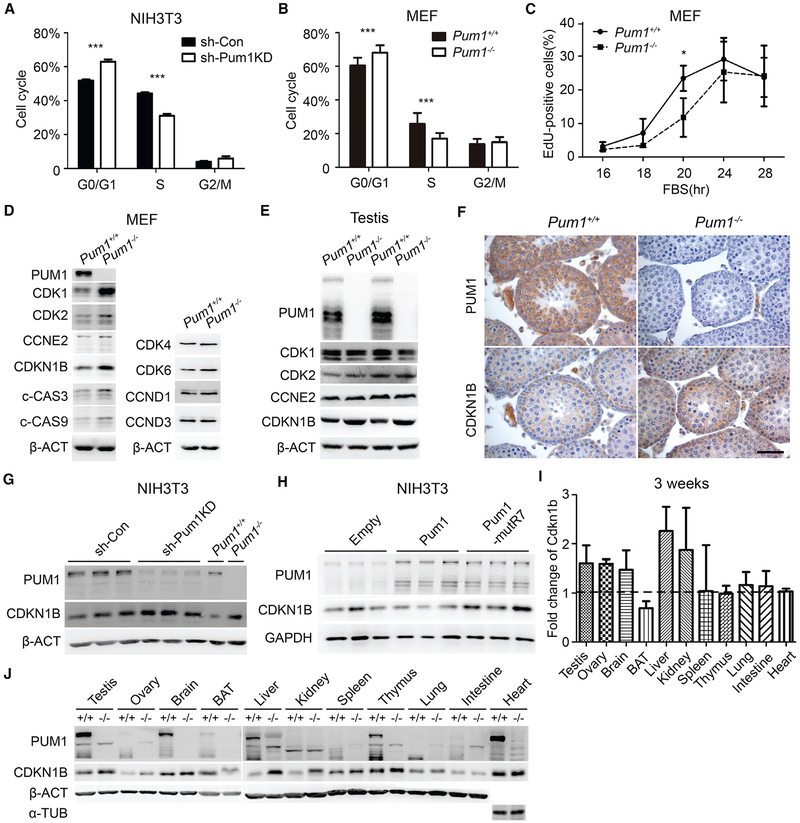
Figure 4. Pum1-Depleted Cells and Mutant Tissues Exhibited Cell Cycle Defects and Increased Expression of Cdkn1b.
(A) Cell cycle analysis of control (sh-Con) and Pum1-knockdown (sh-Pum1KD) NIH 3T3 cells by FACS.
(B) Cell cycle analysis of MEF cells from E13.5 Pum1+/+ (n = 3) and Pum1−/− (n = 3) fetuses.
(C) Cell cycle progression analysis of three pairs of wild-type and mutant MEFs cells with EdU pulse labeling at different time points after resumption of cell cycle from G0 phase.
(D) Western blot analysis of cell cycle and apoptosis regulators in Pum1+/+ and Pum1−/− MEFs.
(E) Western blot analysis of G1-S transition regulators (CDK1, CDK2, Cyc E2, and CDKN1B) in the adult testis of Pum1+/+ and Pum1−/− mice.
(F) Immunostaining for PUM1 and CDKN1B in tissue sections from the testis of 3-week-old Pum1+/+ and Pum1−/− mice. Scale bar, 50 μm.
(G) Western blot analysis of PUM1 and CDKN1B in Pum1 knockdown (sh-Pum1KD) and control (sh-Con) NIH 3T3 cells. Extracts from Pum1−/− and Pum1+/+ were loaded for comparison.
(H) Western blot analysis of PUM1 and CDKN1B in NIH 3T3 cells overexpressing wild-type mouse Pum1 and mutant Pum1.
(I) Cdkn1b expression in Pum1−/− relative to Pum1+/+ tissues by densitometric analysis of western signal using ImageJ software (NIH). All tissues were performed from at least two individual samples and are reported as mean ± SD. The mean intensity value of Pum1+/+ mice was set at 100%.
(J) Western blot analysis of PUM1 and CDKN1B protein levels of different tissues from Pum1+/+ and Pum1−/− mice at 3 weeks of age. For each tissue, left lane is from wild-type and right lane is from knockout tissue.
Data are presented as mean ± SD. *p < 0.05, **p < 0.01, ***p < 0.001.

