Figure 3.
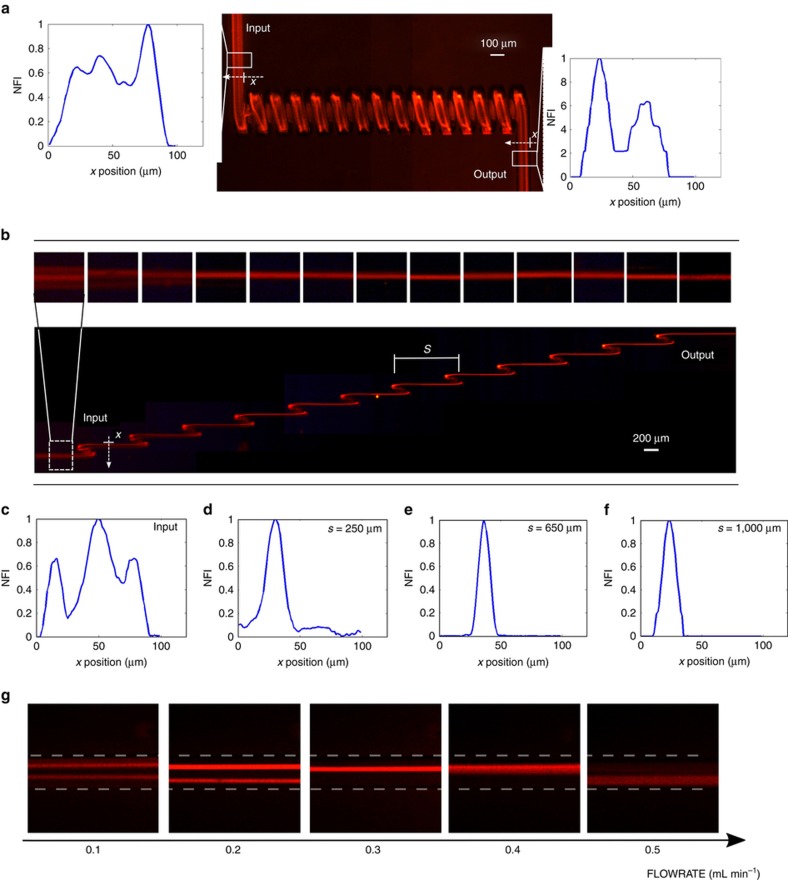
(a) Characterization of the fluorescence distribution generated by beads flowing in a microfluidic coil. The fluorescence distribution at the device input and output are analyzed and no focusing is obtained, as shown in the two insets that report the normalized fluorescence intensity (NFI) versus the channel width. (b) Characterization of a device with s equal to 650 μm, with top insets showing the magnified fluorescence streak lines in the straight sections after each loop. It is possible to observe that the particle focusing increases after each loop (narrowing of the streak line). (c) Fluorescence intensity profile at the device input. Fluorescence intensity profiles at the output of different devices with s values/number of loops equal to: (d) 250 μm/16; (e) 650 μm/12; (f) 1000 μm/7. An optimal focusing condition is found in configuration (e). (g) Fluorescence images at the end of device (e) versus flow rate. An optimal flow rate for efficient focusing is observed at approximately 0.3 mL min−1.

