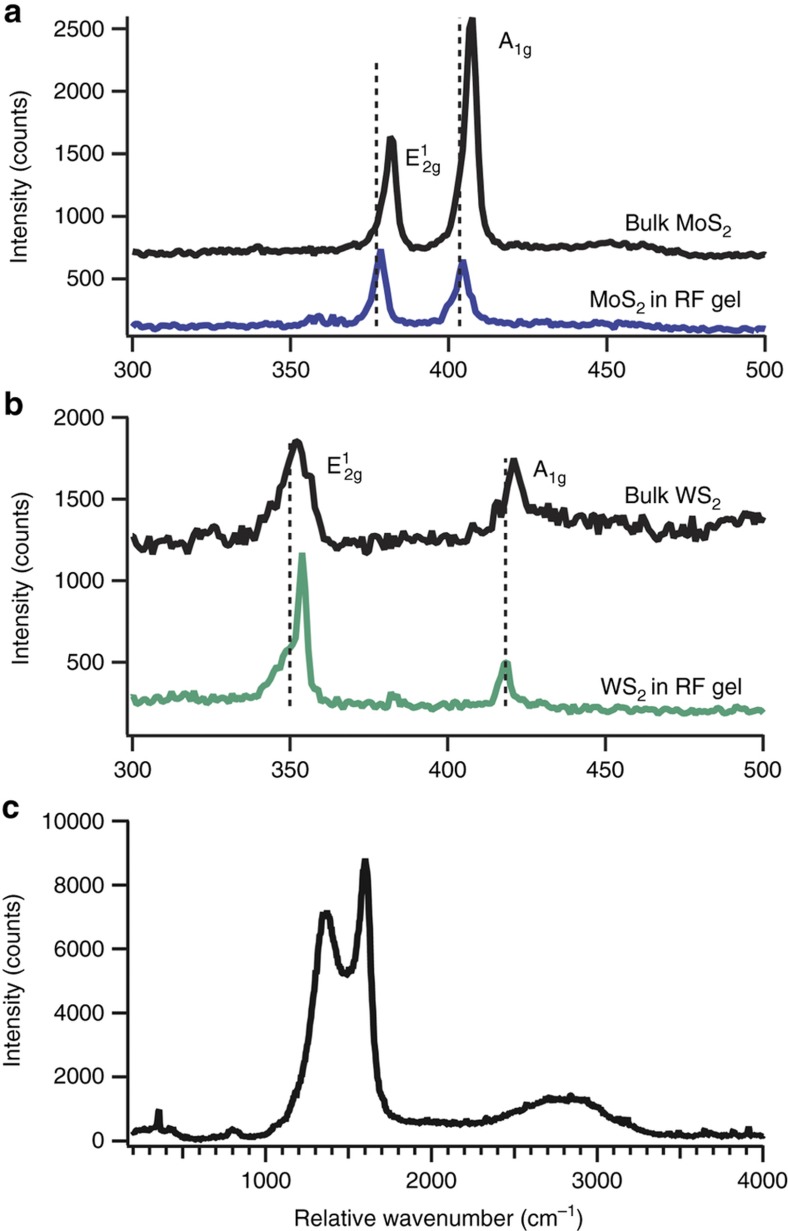
Figure 4.
Raman characterization of MoS2 (a) and WS2 (b) dispersed within the RF matrix of the aerogel (c) for samples synthesized from 17 mg mL−1 TMD dispersions. The Raman scattering of the aerogel (c) was collected from the WS2 composite. For each RF-supported TMD, the bulk Raman spectra is displayed offset for comparison. In addition, the supported TMD and bulk Raman spectra were collected without adjusting the spectrometer grating to prevent alignment-induced shifts in wavenumber. All wavenumbers were further calibrated with a silicon wafer. Vertical dotted lines represent peak centers of the in-plane (E12g) and out of plane (A1g) modes of the exfoliated TMD’s to emphasize the shift from their bulk counterparts due to exfoliation in the case of MoS2 and WS2.

