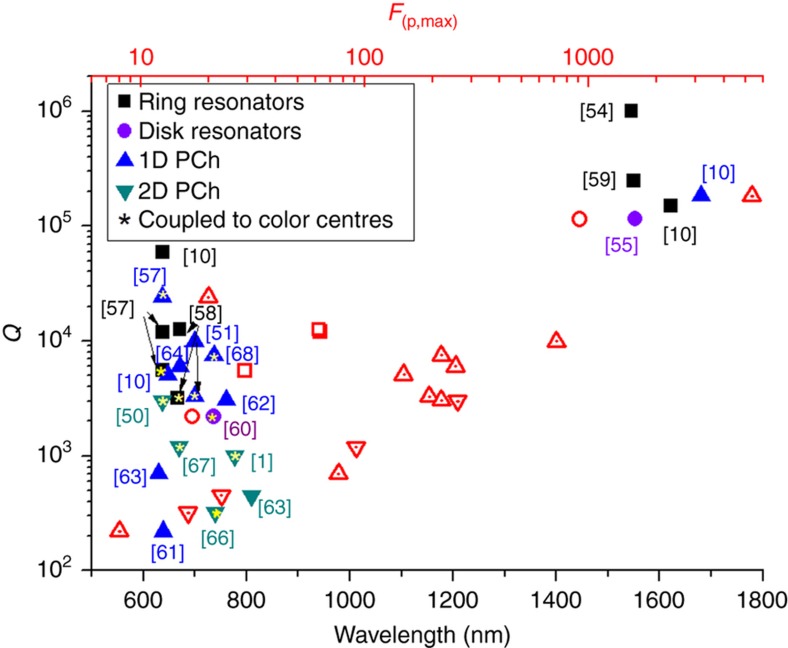
Figure 5.
Optical Q-factors measured for different optical resonators and expected maximum enhancement based on the mode volume design Fp, max he cavity coupled with color centres are indicated with star. Data from Refs. 1,10,50,51,54,55,57–68. We observe that the experimental Q-factors generated when the same cavity is coupled to a color center tend to be much smaller compared to an unloaded cavity and the FSE tends to be much smaller compared to the expected Fp, max. By way of an example in Ref. 50 a measured loaded Q-factor of 3000 (theoretical Q=6000) is achieved with a record FSE=70, while the expected Fp, max~260 based on the cavity mode volume. In Ref. 51 FSE=63 while the expected Fp, max~194.

