Figure 5.
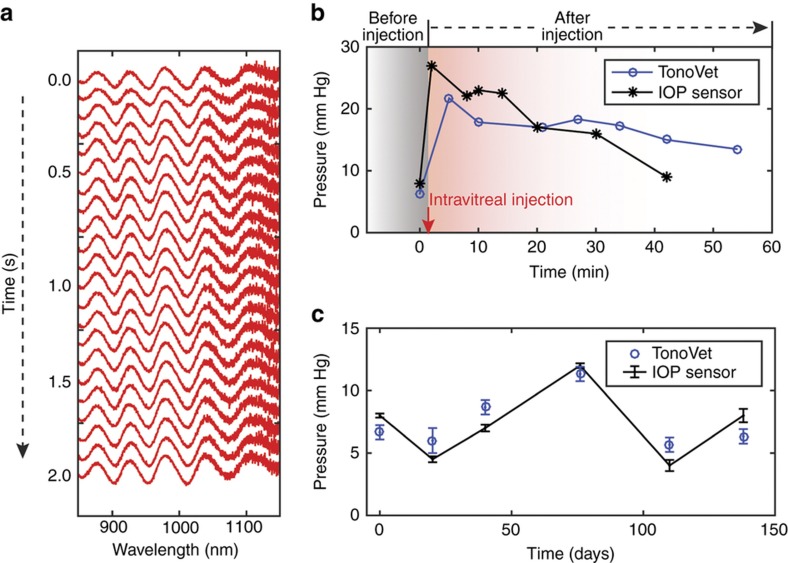
In vivo spectra and IOP measurements. (a) A 2 s block of stacked resonance spectra from a 20 s remote optical detector measurement session performed at 10 Hz. The first spectra obtained at the start of the 2 s block are displayed at the top of the stack. The spectra recorded at subsequent times are sequentially stacked towards the bottom. (b) The IOP measurements before and after intravitreal injection of hypertonic saline to cause transient IOP elevation at 138 days after implantation. The sensor-derived IOPs (black symbol, n=20) and the TonoVet-derived IOPs (open blue circles, n=6) mirror each other and show a rise in IOP after injection followed by a gradual decline over the following 43–55 min. Error bars indicate standard deviations. (c) A comparison of IOP derived from sensor measurements vs TonoVet IOP measurements over a 138-day period.

