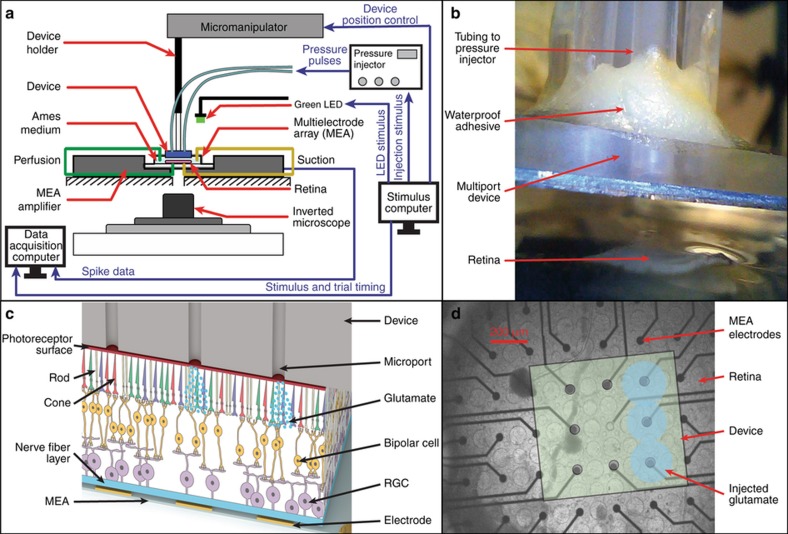
Figure 5.
Experimental setup and close-up details of the device interfaced with the retina. (a) Schematic of the experimental platform showing the arrangement of various components. Retinas extracted from wild-type rats were placed onto a perforated multielectrode array (pMEA) with the retinal ganglion cells (RGCs) in contact with the electrodes atop an inverted microscope to enable visualization of the retina and pMEA. To keep the retina healthy, it was perfused with Ames medium from both the top and bottom of the pMEA. A green LED controlled by signal from a dedicated computer was used to visually stimulate retinal neurons before the device was interfaced. The synapse chip device filled with glutamate was maneuvered and interfaced with the retina by means of a manipulator arm controlled by the computer. Simultaneous multisite injections of glutamate through multiple microports of the synapse chip device were accomplished by pneumatically actuating the microports using a multichannel pressure injector system (also controlled by the stimulus computer). Retinal response data were acquired from the MEA electrodes into another dedicated data acquisition computer. The LED and pressure injector trigger signals from the stimulus computer were also acquired into the data acquisition computer to synchronize the timings of the stimulation events and neural responses recorded for later data analysis. The flow of output signals and input data throughout the setup is represented by the blue lines with labels above. (b) A close-up view of the synapse chip device being lowered and aligned with the MEA electrodes just prior to its interfacing with the retina, which was visually confirmed by observations through the inverted microscope. (c) A cross-section diagram of the synapse chip device interfaced with the retina and glutamate being injected into the retina through a select set of microports aligned over the MEA electrodes. The diagram shows schematically the anatomy of a wild-type retina interfaced with the device microports at the top surface and the MEA electrodes at the bottom surface as well as the various interconnections between different retinal neuronal layers including the photoreceptors (top layer), bipolar cells (middle layer), and RGCs (bottom layer). (d) An overlay picture of the device microports aligned with the electrodes of the MEA as observed and imaged through the translucent retina tissue under an inverted microscope. This alignment allows the glutamate injection sites to be precisely referenced to the centers of the MEA electrodes, which facilitates the analyses of spatial spread of glutamate injections (blue shaded circles) as well as glutamate responsive cells relative to the injection sites. The picture depicts an example where injections of glutamate (three blue shaded circles) represent a dot pattern of the letter ‘I’ character by simultaneously activating three microports along the right edge of the device.

