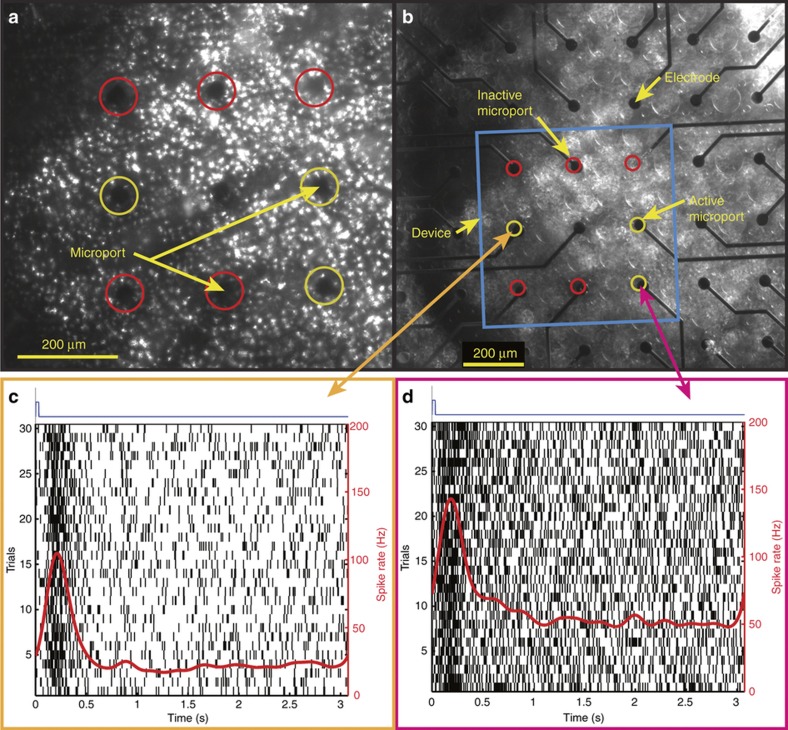
Figure 6.
Synchronized multisite glutamate injections through multiple microports of the device simultaneously evoke robust responses from RGCs near the injection sites. (a and b) Brightfield microscope images of the synapse chip device interfaced with the retina as viewed under an inverted microscope from below through the translucent retinal tissue, with the motorized vertical z axis focus locked to the bottom surface of the device depicting the microports and the top surface of the MEA depicting the electrodes, respectively, during a multiport patterned stimulation of a sideways and inverted ‘L’ character. In both pictures, the overlaid red and yellow circles highlight the locations of the inactive and active microports, respectively. (c and d) Representative examples of two RGC responses that were detected on electrodes directly under the injection sites at the two ends of the ‘L’ character, indicated by the orange and magenta arrows, respectively. Each plot shows the representative spike rate and raster response from a unique RGC under the injection site where the vertical black lines display the timing of individual spikes and are arranged vertically by trial. The red lines show the Gaussian smoothed spike rate for each cell in response to glutamate injections (blue traces at the top display the time-course of glutamate injection). As can be seen, glutamate evoked robust transient excitation of both cells with small time widths comparable to those evoked by visual stimulation but significantly faster response latencies.

