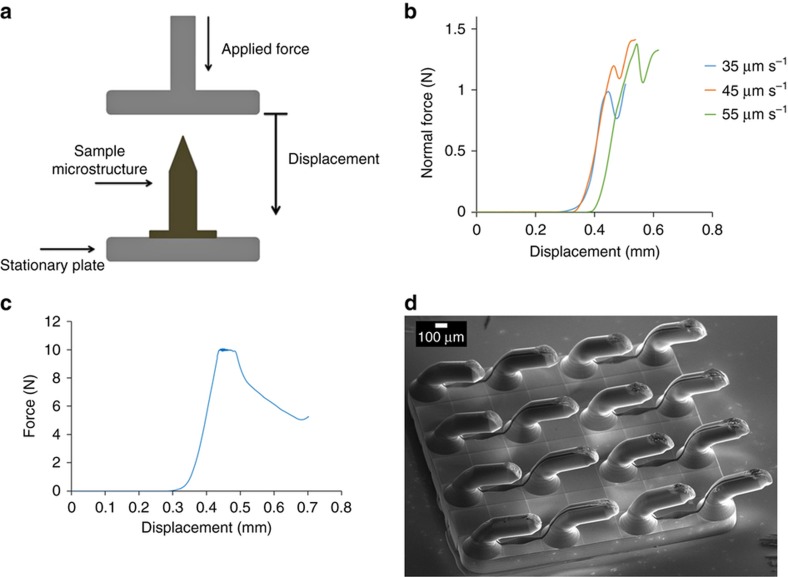
Figure 6.
(a) Schematic setup of compression test on microneedles performed by rheometer. (b) Force (N) versus displacement (mm) curves of compression tests with speeds of 35, 45, and 55 μm s−1, on three separate microneedles connected to a reservoir. (c) Force (N) versus displacement (mm) graph of a compression test on an array of 16 microneedles by applying 35 μm s−1 speed. (d) SEM image of the microneedle array with tip heights of 150 μm after compression test.

