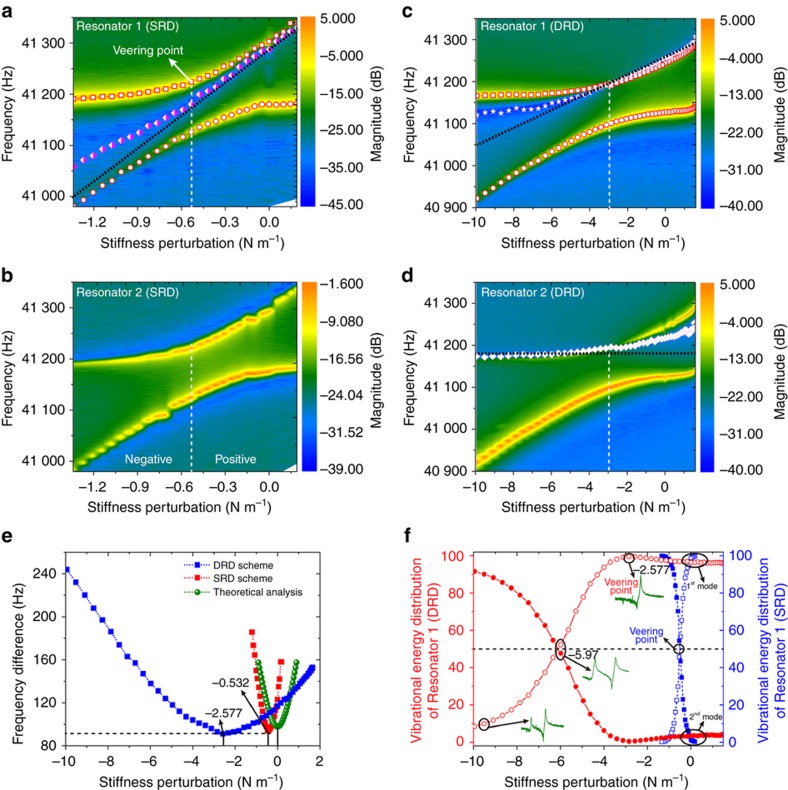
Figure 5.
Experimentally measured frequency-perturbation magnitude responses of Resonator 1 (a and c) and Resonator 2 (b and d) under the SRD and DRD schemes. The squares show the variations of the resonances of the second mode, and the circles, those of the first mode. The magenta diamonds in (a) indicate the variations of the anti-resonances of Resonator 1 under the SRD scheme. The stars in (c) and the white diamonds in (d) indicate the variations of the anti-resonances of Resonator 1 and Resonator 2 under the DRD scheme, respectively. (e) Frequency difference between the two modes under different driving schemes. (f) Vibrational energy distributions of Resonator 1 under the two driving schemes. The black dotted lines in (a, c and d) indicate the theoretical anti-resonance loci.

