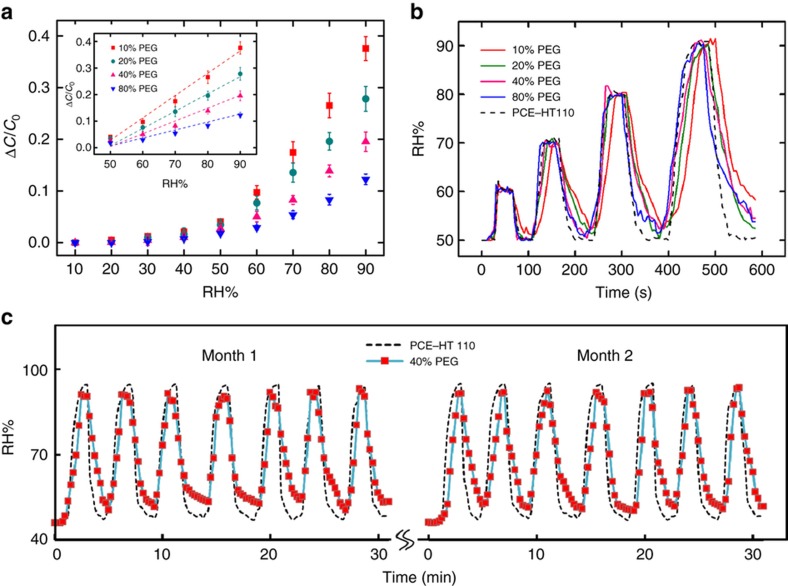
Figure 4.
(a) Measured capacitive changes of the humidity sensors under different RH levels (dots) with theoretical predictions (dashed lines). The sensors were fabricated with different PEG contents (10, 20, 40, and 80%) during the polymerization process, and five identical devices were tested for each PEG ratio. (b) Sensor responses to environmental humidity change with different PEG contents (10, 20, 40, and 80%). RH was changed between 50 and 60%, then 50 and 70%, 50 and 80%, and finally 50 and 90%, consecutively. (c) Cyclic humidity tests over a two-month period using the sensor with 40% PEG content. RH was controlled, changing between RH 50% and RH 90%, repeatedly.

