Figure 5.
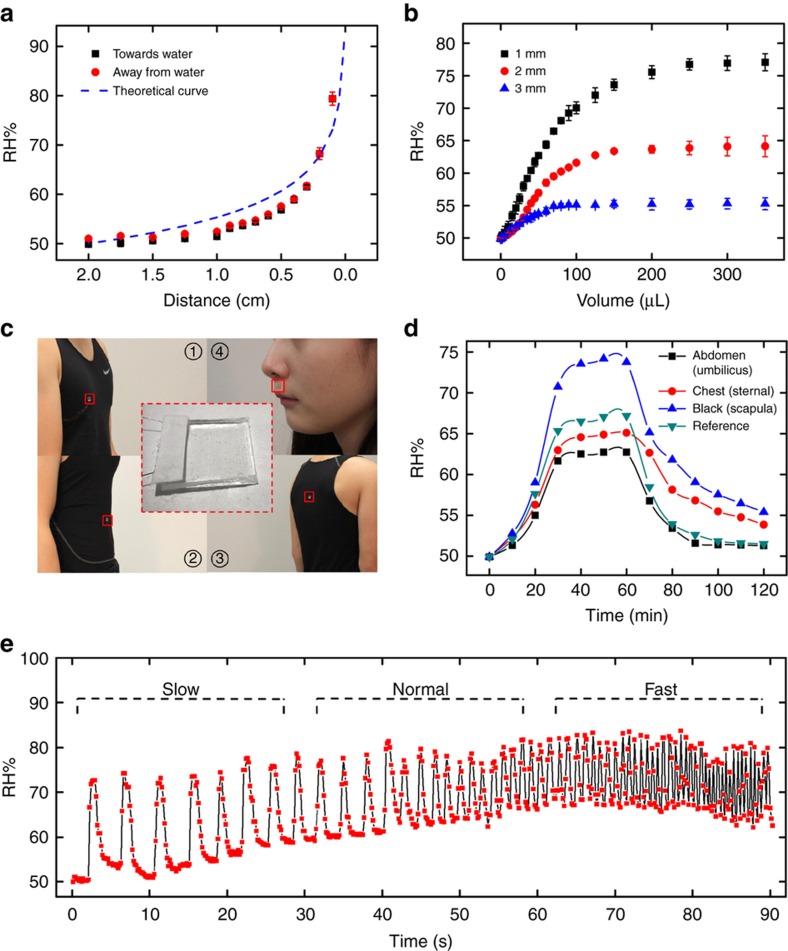
(a) Changes of RH, as the PEDOT:PSS/PEG hybrid humidity sensor moved towards and away from the water surface. The theoretical curve was plotted with a dashed line. (b) Changes of RH, as water was introduced onto fabric constantly. Distances between sensor and fabric were fixed at 1, 2, and 3 mm. (c) Pictures of sensors on clothes (abdomen, chest, and back) and skin (under nose). (d) Changes of RH calculated from capacitive changes of the sensors attached on abdomen (umbilicus), chest (sternal), and back (scapula), respectively, with a comparison to the reference that calculated from changes in the weight of the clothes with sweat. (e) Responses of the sensor at different breathing rates.

