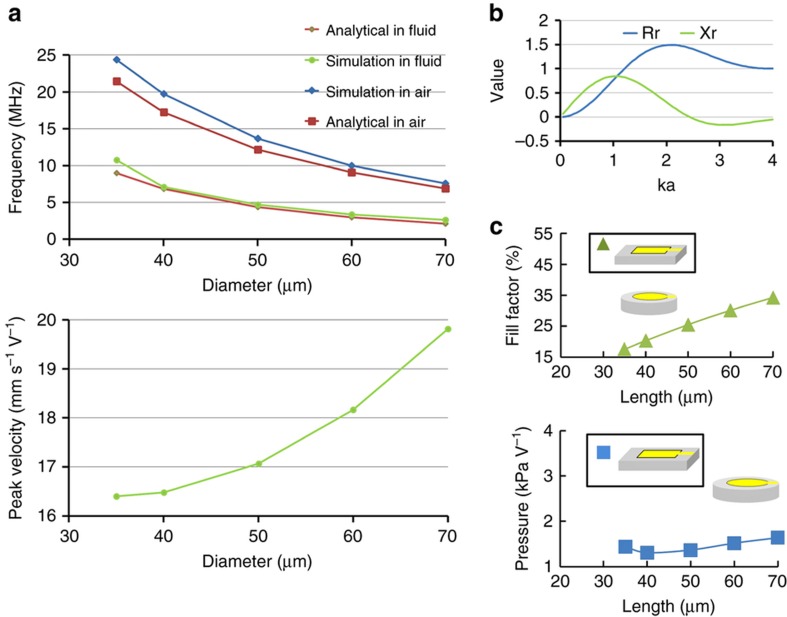
Figure 3.
(a) Frequency response in air and fluid from the simulation and analytical solution (top). Peak velocity from the analytical solution (bottom). (b) The resistive rr and inductive xr terms in the acoustic radiation impedance plotted versus ka. (c) Fill-factor (top) and computed pressure output (bottom) versus PMUT size.

