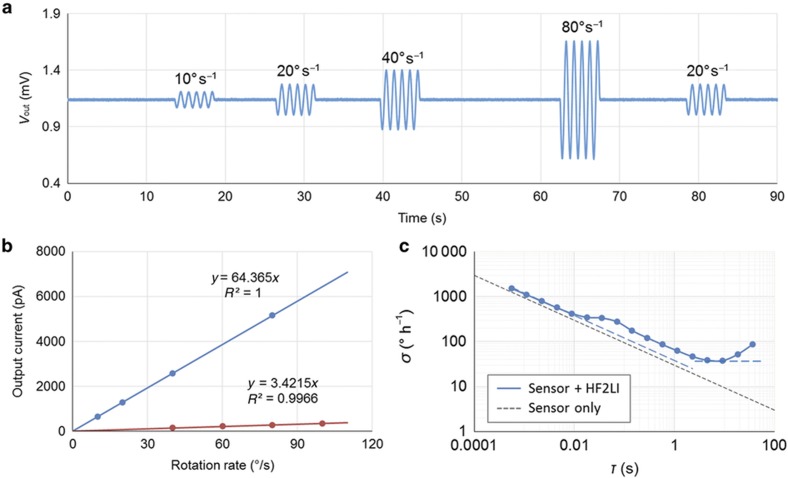
Figure 7.
Resonant gyroscope performance characterization. (a) Mode-matched gyroscope output response to different rotation rates. The plot shows 90 s of continuous measurement. A consistent scale factor is measured, and no ZRO drift is observed. (b) Measured scale factor of the gyroscope with and without quadrature cancellation. Voltage output is converted into current knowing the TIA gain. Mode-matching after quadrature cancellation leads to a 20-fold improvement in the scale factor. (c) Allan deviation plot of mode-matched gyroscope. An ARW of 0.63° (√h)−1 and a bias instability of 37.7° h−1 are measured. ARW, angle random walk; TIA, transimpedence amplifier; ZRO, zero rate output.

