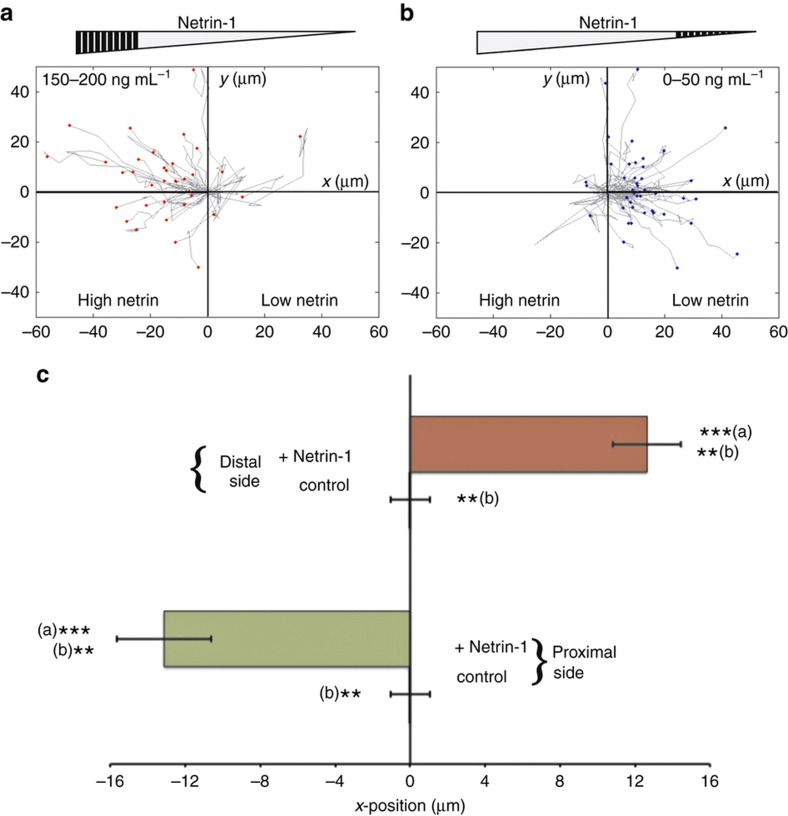
Figure 7.
Biphasic behavior of growth cone trajectories. (a and b) A plot of the trajectories of all the axons that were exposed to high and low concentration ranges of netrin-1 (denoted by the shaded region of the gray triangle on the top). The origin in these plots denotes the initial position of the growth cones before the beginning of the gradient application. (c) A plot of the average displacement, along the axis of the microjets, of the growth cones in the experimental and control devices, from the proximal (150–200 ng mL−1) and distal (0–50 ng mL−1) sections of the chamber (n=40 and 33 in distal and proximal experimental chambers, respectively, and 47 in control chambers, where the two sections are equivalent and therefore combined). Error bars denote s.e.m. ***(a) indicates a P-value<0.005 between the proximal and distal section axons exposed to the netrin-1 gradient. **(b) indicates a P-value<0.01 between the axons of the experimental and control devices. The Mann–Whitney test was used to determine the statistical significance.

