
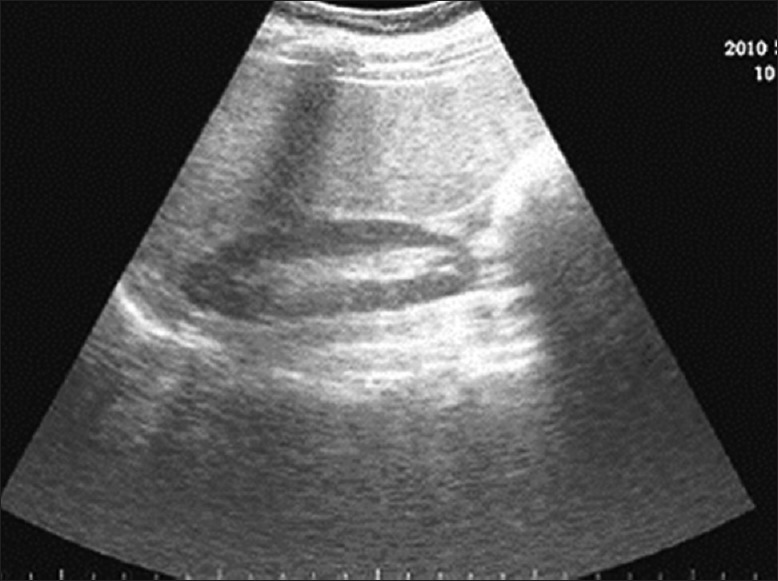
Figure 2.
ultrasound scan showing increased echotexture of the liver in comparison to echotexture of the renal cortex: grade I fatty liver
Official websites use .gov
A
.gov website belongs to an official
government organization in the United States.
Secure .gov websites use HTTPS
A lock (
) or https:// means you've safely
connected to the .gov website. Share sensitive
information only on official, secure websites.
ultrasound scan showing increased echotexture of the liver in comparison to echotexture of the renal cortex: grade I fatty liver