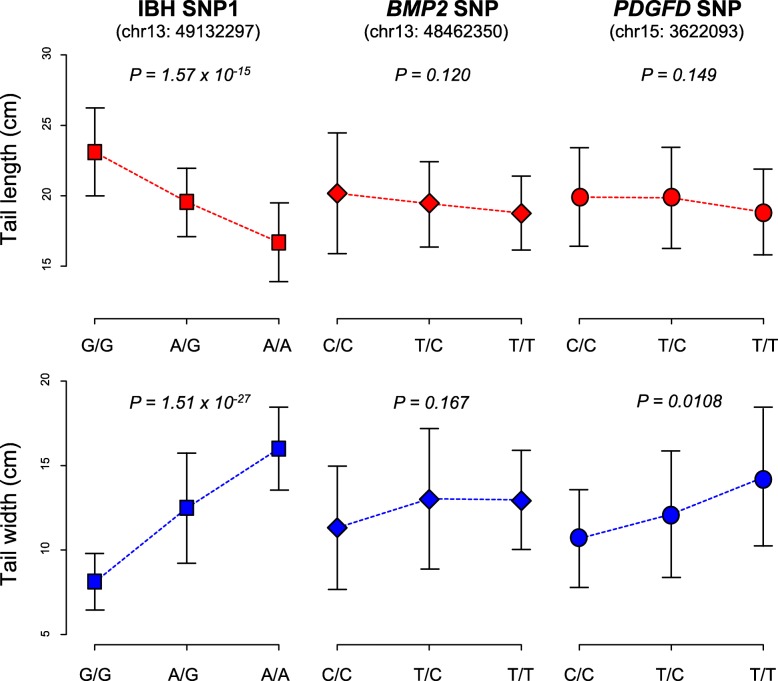
Fig. 5.
Predictive power of candidate SNPs on tail phenotypes. Strength of association was tested between candidate SNPs (IBH SNP1, IBH SNP2, BMP2 SNP and PDGFD SNP) and tail phenotypes (length and width). Two IBH markers are in complete LD, therefore only one is showed. P values were calculated based on linear regressions after adjustment for age and sex (assuming an additive effect of single allele). A more complete analysis is in Additional file 1: Table S4

